
FOCUS ON: US Inflation Reports and ECB Decision
- Collapse of Silicon Valley Bank and hawkish Fed stance triggers uptick in price volatility
- US Non-Farm Payroll report offers mixed messages
- Traders of euro assets prepare for ECB announcement on Thursday
Trading Ideas
We created this Weekly Tips section to share possible trade entry and exit points based on our technical analysis. We also have other methods to validate our trades which we can’t publicly share that help to increase their success. All our trades include entry and at least one target price. Stop losses are applied at the reader’s discretion. Our strategies typically trade with a wide stop loss, and risk is further mitigated by trading in small sizes.
Instrument | Price | Hourly | Daily |
GBP/USD | 1.2090 | Buy | Strong Buy |
EUR/USD | 1.0708 | Strong Buy | Strong Buy |
USD/JPY | 134.12 | Strong Sell | Strong Sell |
S&P 500 | 3,900 | Strong Sell | Strong Sell |
NASDAQ 100 | 11,974 | Strong Sell | Strong Sell |
FTSE100 | 7,670 | Strong Sell | Strong Sell |
Gold | 1,879 | Strong Buy | Strong Buy |
Crude Oil WTI | 76.63 | Neutral | Strong Sell |
Bitcoin | 22,145 | Sell | Strong Sell |
Ethereum | 1,584 | Sell | Sell |
UTC: 09:36
US Dollar Basket Index (DXY)
The appetite for risk in the forex markets flip-flopped last week, and after a midweek rush to the security of the US dollar, most major currencies ended up making weekly gains on the greenback. The move tied in with ‘hawkish’ comments made by US Federal Reserve Chair Jerome Powell on Tuesday, which pointed to the next Fed interest rate hike being 50 basis points. During Tuesday’s session, the hint of a more aggressive approach took the US Dollar Basket from lows of 103.76 to highs of 105.48.
By Thursday, concerns about how interest rates were hurting the economy hit stock prices and the dollar. The impending collapse of Silicon Valley Bank might not trigger a banking crisis on the same scale as seen in 2008, but it was a sign that the ‘real economy’ also needs support.
Friday’s Non-Farm Payroll jobs report showed more signs that the overall jobs market remained strong, but the crucial ‘average hourly earnings’ rate rose just 0.24% in February, a 4.6% year-over-year gain that was below the 4.8% estimate. That leaves the door open to the Fed easing off on its aggressive monetary policy, posting a 25-basis point hike at its next meeting, and still achieving a soft landing for the economy.
US Dollar Basket Chart – Daily Price Chart – SMA Convergence
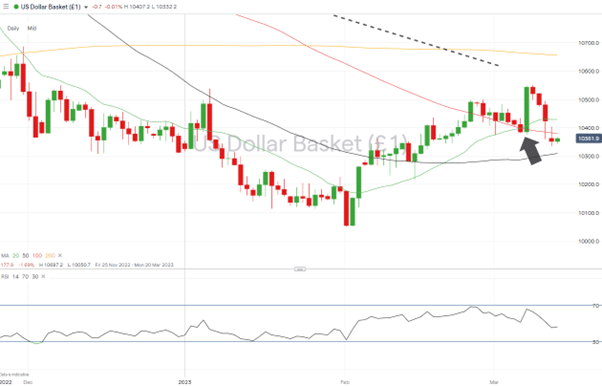
Source: IG
US Dollar Basket Chart – Hourly Price Chart
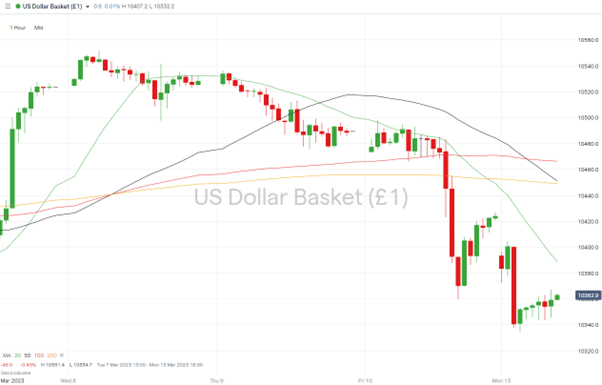
Source: IG
Short positions
- Entry Level 1: 104.29 – Convergence of the 20, 50 and 100 SMAs on the Daily Price Chart leaves traders with an option of three key metrics to use to enter into trades which predict further weakness in the US dollar. The 20 SMA is in the region of 104.29, and with Friday’s closing price being 104.23, that price range appears to be one option for short dollar trades.
- Price Target 1: 103.09 – Region of 50 SMA on Daily Price Chart and 1.30 ‘round number’ price level which can be expected to offer support.
- Price Target 2: 102.17 – Intraday low price printed on 14th February. Part of a bullish ‘swing-low’ price pattern.
- Stop Loss: > 105.51 – Eight-week price high printed on 8th March.
Long positions
- Entry Level 1: 103.79 – Region of 100 SMA on the Daily Price Chart and applying a momentum-based strategy to capture further upward price movement.
- Price Target 1: 104.97 – Price high printed on 24th February.
- Price Target 2: 105.37 – In extension, the year-to-date price high recorded on 6th January 2023.
- Stop Loss: < 103.09 – Region of 50 SMA on Daily Price Chart and 103.00 ‘round number’ price level.
GBPUSD
With the RSI on the GBPUSD Daily Price Chart at 53, the market is neither ‘overbought’ nor ‘oversold’. That leaves room for price to move in either direction on that timeframe before momentum meets significant resistance.
Range-bound trading can’t be ruled out. Two key SMA’s, the 50 and 100 SMAs on the Daily Price Chart, offer resistance in the region of 1.213, and the 200 SMA offers support at 1.185.
Daily Price Chart – GBPUSD Chart – Daily Price Chart
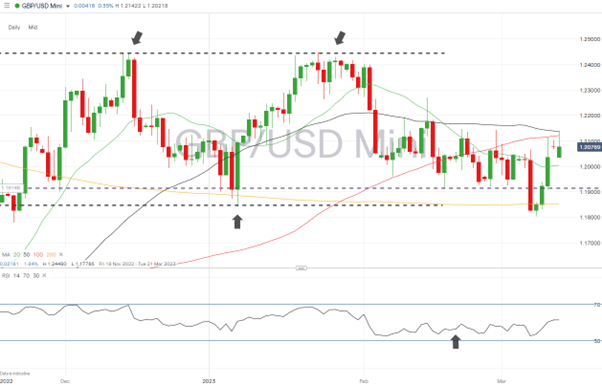
Source: IG
GBPUSD Chart – Hourly Price Chart
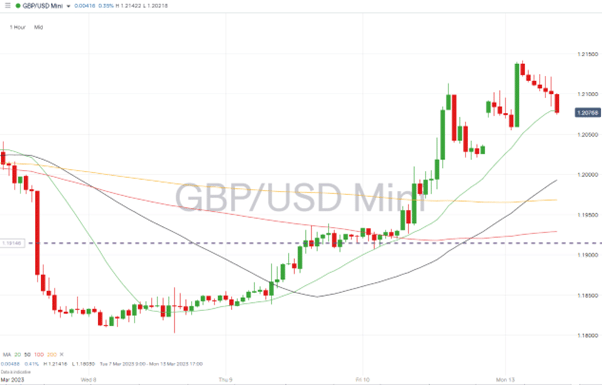
Source: IG
Short positions
- Entry Level 1: 1.21359 –Region of the 50 SMA on the Daily Price Chart. Application of range-trading strategies.
- Price Target 1: 1.20040 – Just above the psychologically important 1.200 price level and region of 20 SMA on the Daily Price Chart.
- Price Target 2: 1.180306 – Price low of 8th March.
- Stop Loss: > 1.22 – Round number price level.
Long positions
- Entry Level 1: 1.20040 – Region of the 20 SMA on the Daily Price Chart and ‘round number’ support offered by 1.200 price level.
- Price Target 1: 1.21361 – Region of 500 SMA on Daily Price Chart.
- Price Target 2: 1.22156 – The 61.8% Fibonacci retracement price level of the price fall between 14th December 2022 and 6th January 2023.
- Stop Loss: < 1.18525 – Region of 200 SMA on Daily Price Chart and year-to-date price low printed on 8th March.
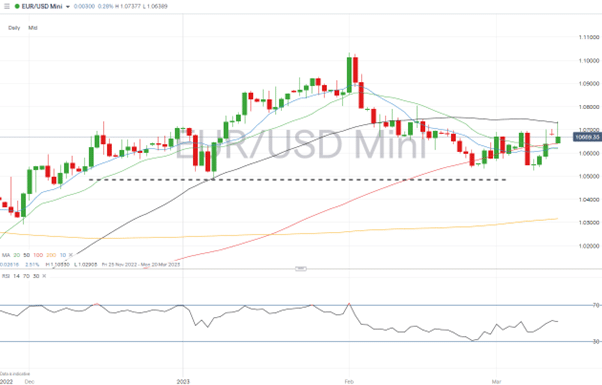
EURUSD
The ECB makes its next interest rate announcement on Thursday 16th March, with the market pricing in a rise of 50 basis points. With the RSI at 51 and price trading mid-range in a channel dating back to the beginning of February, any surprises from the ECB could trigger price moves which would have room to develop before meeting significant resistance.
EURUSD Chart – Daily Price Chart
Source: IG
EURUSD Chart – Hourly Price Chart
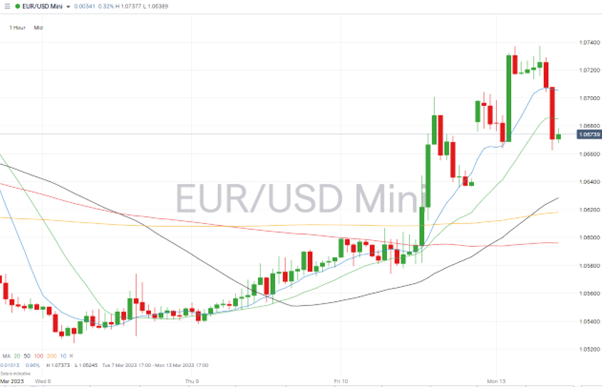
Source: IG
Short positions
- Entry Level 1: 1.07373 – Selling into strength which takes price within the range of the March month-to-date highs. This price printed on 13th March.
- Price Target 1: 1.06414 – Region of the 100 SMA on the Daily Price Chart.
- Price Target 2: > 1.06114 – 38.2% Fib retracement level of the EURUSD price fall between January 2021 and September 2022
- Stop Loss: > 1.08046 – Price high of 14th February and region of psychologically important 1.08 price level.
Long positions
- Entry Level 1: 1.06201 – 1.06227 – 10 and 20 SMAs on Daily Price Chart have converged and offer support in this price range.
- Price Target 1: 1.07373 – Month-to-date price high printed on 13th March.
- Stop Loss: <1.05245 – Price low of 8th March.
Indices
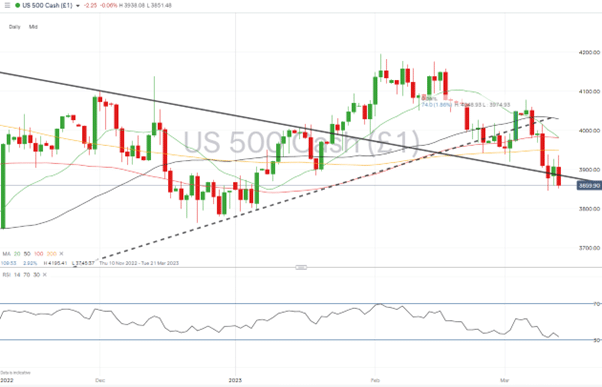
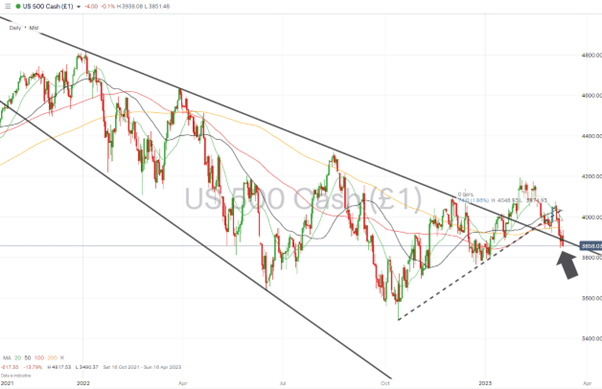
S&P 500
The fallout from the SVB collapse dragged down the finance sector and resulted in the S&P 500 index posting a 3.68% price fall on the week. That topped the slide in tech stocks, with the Nasdaq 100 posting a 1.28% loss and reflects that interest rate and liquidity concerns are weighing as heavily on ‘main street’ as they are on Silicon Valley.
S&P 500 Chart – Daily Price Chart
Source: IG
S&P 500 – Daily Price Chart – Trendline
Source: IG
Short positions
- Entry Level 1: 3,890 – Applying a momentum-based strategy and selling into price weakness which takes price below the October 2022 to February 2023 trendline.
- Price Target 1: 3,763 – Price low of 22nd December 2022. With the RSI on the Daily Price Chart at 33, locking in profits would be recommended as the index is moving towards being ‘oversold’ on that timeframe.
- Stop Loss: > 3,949 – Region of 200 SMA on the Daily Price Chart.
Long positions
- Entry Level 1: 3,890 – If price can move back above the support/resistance offered by the multi-month trend line, then there is little near-term resistance to further upward price movement.
- Price Target 1: 3,949 – Region of 200 SMA on the Daily Price Chart.
- Price Target 2: 3,949 – Convergence of 20 and 100 SMAs on Daily Price chart and 4,000 ‘round number’ price level.
- Stop Loss: < 3,845 – Month-to-date price low printed on 10th March.
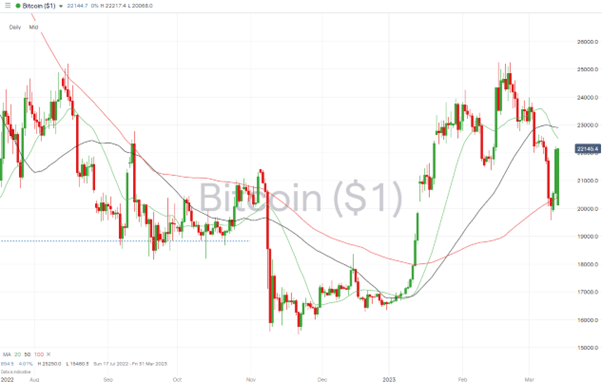
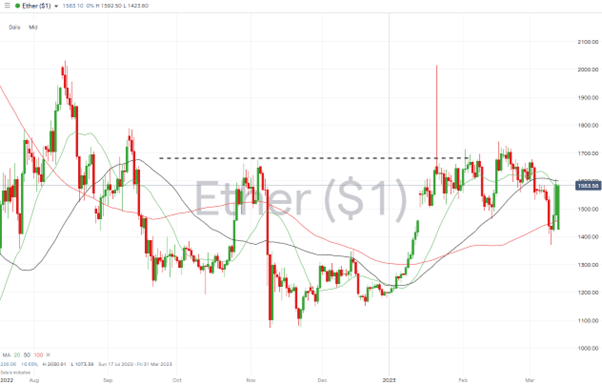
Crypto – Bitcoin & Ethereum
Events at Silicon Valley Bank damaged confidence in the digital sector, which had repercussions for both major cryptocurrencies. At one point, Bitcoin and Ethereum were showing week-to-date losses above 10% but recovered on hopes of an SVB support package materialising.
Bitcoin Price Chart – Daily Price Chart
Source: IG
Bitcoin Long positions
- Entry Level 1: 20,399 – With volatility at high levels, there could be an opportunity to buy into weakness which takes price to level of the 100 SMA on the Daily Price Chart.
- Price Target 1: 22,903 – Region of 50 SMA on Daily Price Chart.
- Price Target 2: 25,250 – Year-to-date price high of 16th February.
- Price Target 3: 28,409 – In extension, the 61.8% Fib retracement level of the upward price move in Bitcoin recorded between February 2019 and November 2021.
- Stop Losses: < 20,000 – Round number support level.
Ethereum
Ethereum Chart – Daily Price Chart
Source: IG
Ethereum Long positions
- Entry Level 1: 1,458 – Region of 100 SMA on Daily Price Chart and the 1,463-price low of 13th February.
- Price Target 1: 1,600 – Region of 50 SMA on Daily Price Chart.
- Price Target 2: 1,742 – Price high of 16th February 2023.
- Stop Losses: < 1,369 – Price low of 10th March.
Risk Statement: Trading financial products carries a high risk to your capital, especially trading leverage products such as CFDs. They may not be suitable for everyone. Please make sure that you fully understand the risks. You should consider whether you can afford to take the risk of losing your money.

Forextraders' Broker of the Month
BlackBull Markets is a reliable and well-respected trading platform that provides its customers with high-quality access to a wide range of asset groups. The broker is headquartered in New Zealand which explains why it has flown under the radar for a few years but it is a great broker that is now building a global following. The BlackBull Markets site is intuitive and easy to use, making it an ideal choice for beginners.