
FOCUS ON: Markets Brace for a Busy Week
- Sideways trading patterns are forming as key data points appear on the horizon
- Risk-on assets need a catalyst to support another move up from March lows.
- US GDP and hugely important earnings figures will be released this week.
Trading Ideas
We created this Weekly Tips section to share possible trade entry and exit points based on our technical analysis. We also have other methods to validate our trades which we can’t publicly share that help to increase their success. All our trades include entry and at least one target price. Stop losses are applied at the reader’s discretion. Our strategies typically trade with a wide stop loss, and risk is further mitigated by trading in small sizes.
Instrument | Price | Hourly | Daily |
GBP/USD | 1.2412 | Strong Sell | Neutral |
EUR/USD | 1.0966 | Strong Sell | Strong Buy |
USD/JPY | 134.20 | Buy | Strong Buy |
S&P 500 | 4,111 | Neutral | Strong Buy |
NASDAQ 100 | 12,933 | Neutral | Neutral |
FTSE100 | 7,891 | Strong Sell | Strong Buy |
Gold | 1,978 | Strong Sell | Neutral |
Crude Oil WTI | 76.71 | Strong Sell | Strong Sell |
Bitcoin | 27,391 | Strong Sell | Strong Sell |
Ethereum | 1,837 | Strong Sell | Strong Sell |
UTC: 09:12
US Dollar Basket Index (DXY)
Last week’s weekly move in the US Dollar Basket index price was -0.01%. Not only was the gross price shift almost zero but there were also relatively few spikes in volatility over the five days. A period of price consolidation is unsurprising following the rebound in risk-on assets since March. Still, traders should be prepared for the upcoming week’s data reports which could trigger a shift in momentum.
US Dollar Basket Chart – Daily Price Chart – Sideways Trading Pattern
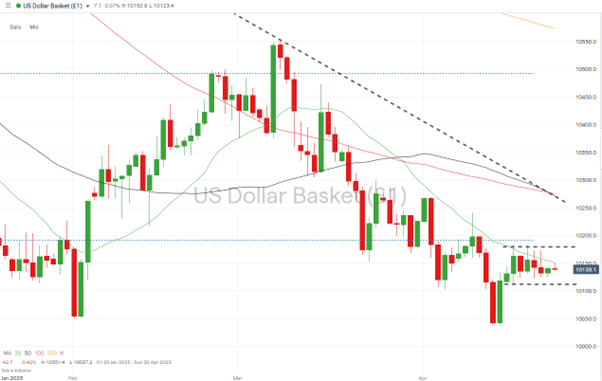
Source: IG
US Dollar Basket Chart – Hourly Price Chart
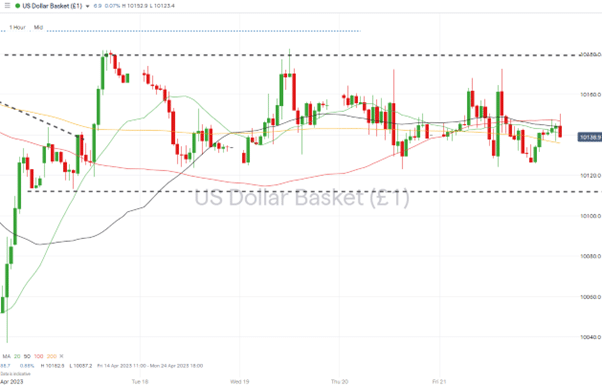
Source: IG
Short positions
- Entry Level 1: 101.914 – The sideways trading pattern has formed below the 50% Fibonacci retracement of the bull run between January 2021 and October 2022. That resistance level now continues to offer opportunities to short-sell USD.
- Price Target 1: 101.50 – Region of the 20 SMA on the Daily Price Chart.
- Price Target 2: 101.13 – Weekly low printed on Monday 17th April.
- Price Target 3: 100.00 – In extension, psychologically important price level.
- Stop Loss: > 102.89 – Region of the convergence of 50 and 100 SMA on the Daily Price Chart.
Long positions
- Entry Level 1: 101.13 – Last week’s price low, printed on Monday 17th April forms the bottom of the current sideways trading channel.
- Price Target 1: 101.82 – Resistance trendline, which marks the top of last week’s consolidation pattern.
- Price Target 2: 101.914 – 50% Fib retracement level.
- Stop Loss: < 100.00 – ‘Round number’ support level.
GBPUSD
Sterling currency crosses also had a quiet week despite last week being busy regarding data releases. The 0.29% increase in the value of GBPUSD was supported by UK inflation data showing the economy was still running hotter than the Bank of England would like; however, traders failed to support sterling to a large extent thanks to forecasts of year-end inflation levels being half of what they currently are.
With the RSI on the Daily Price Chart at 56.8, the market is far from being ‘overbought’, leaving room for further upward movement if inflation fears persist.
Daily Price Chart – GBPUSD Chart – Daily Price Chart
Source: IG
GBPUSD Chart – Hourly Price Chart
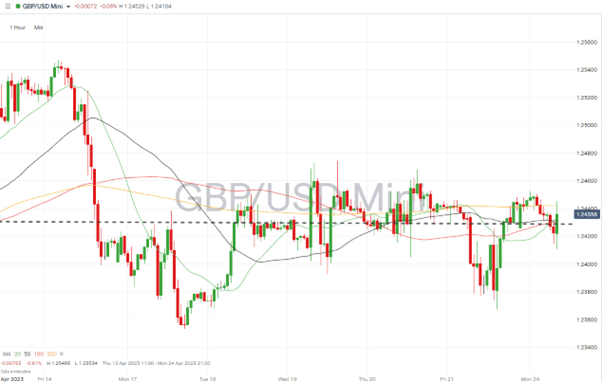
Source: IG
Short positions
- Entry Level 1: 1.24325 – Upper trendline of sideways channel formed in Q1 of 2023. Also, region of 20 SMA on the Daily Price Chart.
- Price Target 1: 1.22081 – Region of the 100 (and 50) SMAs on the Daily Price Chart.
- Price Target 2: 1.18030 – Bottom of sideways channel and year-to-date price low printed on 8th March 2023.
- Stop Loss: > 1.25466 – Resistance level formed by year-to-date price high of 14th April.
Long positions
- Entry Level 1: 1.24325 – A shift in sentiment towards interest rates being higher for longer could see GBPUSD confirm its break of the multi-month trendline resistance.
- Price Target 1: 1.27393 – Resistance offered by a downward trendline dating back to May 2021.
- Price Target 2: 1.28855 – in extension, region of the 50 SMA on the Monthly Price Chart.
- Stop Loss: < 1.23534 – Swing-low price level recorded on 17th April.
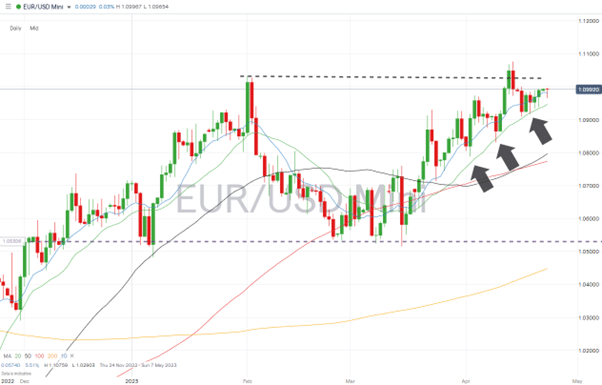
EURUSD
EURUSD continues to trade above the 20 SMA on the Daily Price Chart. Price has failed to close below that key metric since 16th March, and until that situation changes, the path of least resistance appears upward.
EURUSD Chart – Daily Price Chart
Source: IG
EURUSD Chart – Hourly Price Chart
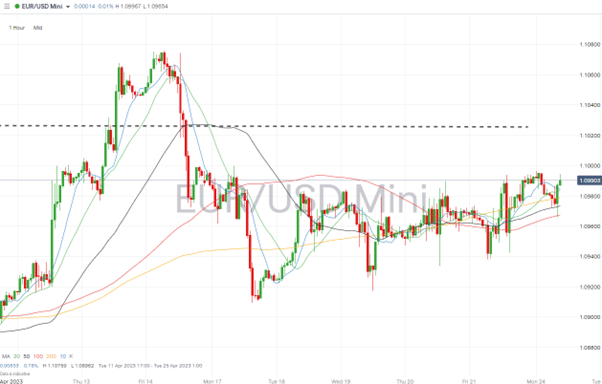
Source: IG
Short positions
- Entry Level 1: 1.1000 – The underlying trend might be upward, but price has failed to break the psychologically important price level of 1.1000, which has acted as resistance since Friday 14th April.
- Price Target 1: 1.09819 – Region of the 10 SMA on the Daily Price Chart.
- Price Target 2: 1.09459 – Region of 20 SMA on Daily Price Chart. Price has failed to close below this support metric since 16th March.
- Stop Loss: > 1.10759 – Year-to-date price high printed on 14th April.
Long positions
- Entry Level 1: 1.09459 – Buying into any weakness which takes price into the region of the 20 SMA on the Daily Price Chart.
- Price Target 1: 1.1000 – ‘Round number’ resistance offered by the ‘round number’ 1.1000 price bar.
- Price Target 2: 1.10759 – Year-to-date price high printed on 14th April.
- Stop Loss: < 1.09093 – Swing-low price low of 13th April.
Indices
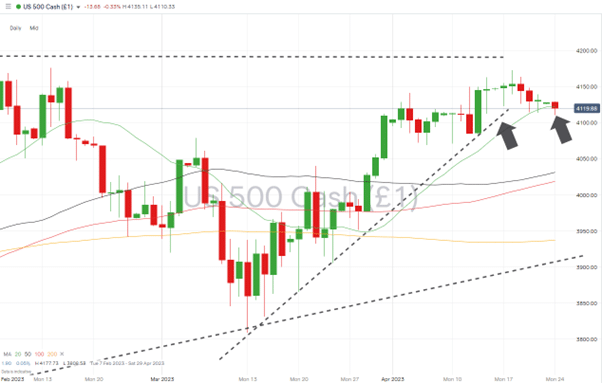
S&P 500
A weeklong period of price consolidation has resulted in a break of the supporting trendline of the rally that started on 13th March but has not resulted in a break of the 20 SMA on the Daily Price Chart. While that key metric holds, there is room for upward momentum to continue. The 4,189 price-level offers resistance as it marks the point where the index will have gained +20% in value from the price-low of October 2022 and confirms a technical bull market has formed.
Huge corporations are due to announce their Q1 earnings this week – with those reports potentially bringing about a substantial price move in either direction.
S&P 500 Chart – Daily Price Chart – Moving Average Support
Source: IG
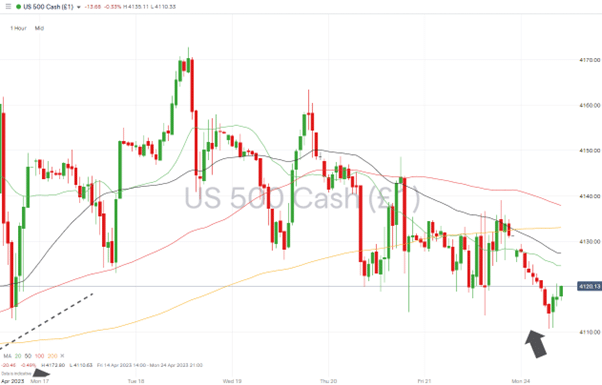
S&P 500 – Hourly Price Chart
Source: IG
Short positions
- Entry Level 1: 4,122 – A break of the 20 SMA on the Daily Price Chart opens the door to a freefall in US stock prices, with the next major support levels being in the region of 4,030.
- Price Target 1: 4,031 – Region of the 50 SMA on Daily Price Chart.
- Price Target 2: 4,000 – Psychologically important price level.
- Stop Loss: > 4,172 – Price high of 18th April 2023.
Long positions
- Entry Level 1: 4,108 – With the RSI on the Daily Price Chart moving from 63.3 to 56.6 last week, there is room for upward price moves before the index becomes overbought. Price has traded above the 20 SMA on the Daily Price Chart since 24th March, making that metric a likely target for those looking to go long.
- Price Target 1: 4,195 – Year-to-date price high of 2nd February 2023.
- Price Target 2: 4,202 – Region of 100 SMA on Weekly Price Chart.
- Stop Loss: < 4,083 – Price low of 13th April and last time multi-week trendline acted as support.
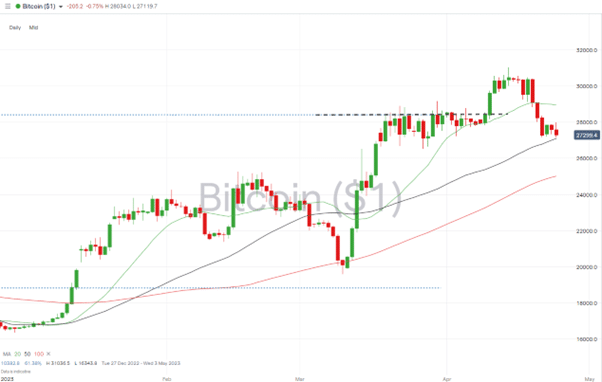
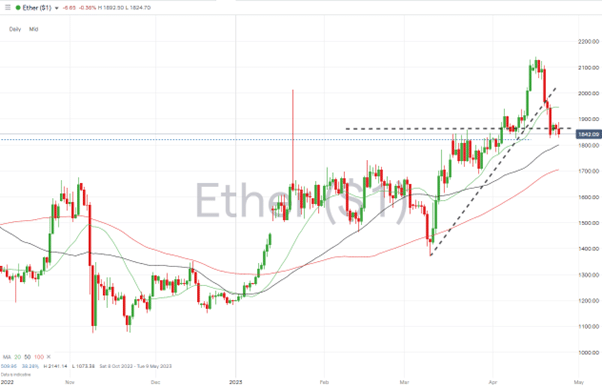
Crypto – Bitcoin & Ethereum
A cooling in risk appetite and increased confidence in the fiat financial system resulted in both major cryptos giving up ground last week. Bitcoin lost more than 8% of its value, and Ethereum investors suffered a +12% loss.
Bitcoin Price Chart – Daily Price Chart
Source: IG
Bitcoin Long positions
- Entry Level 1: 27,103 – Region of 50 SMA on Daily Price Chart.
- Price Target 1: 28,952 – Level of 61.8% Fib retracement formed by the upward price move in BTC recorded between February 2019 and November 2021.
- Price Target 1: 30,000 – Round number price level.
- Price Target 2: 36,154 – 50% Fib level of the 2019 – 2021 price move.
- Stop Losses: < 26,525 – Swing-low of 27th March 2023.
Ethereum
Ethereum Chart – Daily Price Chart
Source: IG
Ethereum Long positions
- Entry Level 1: 1,820 – 23.6% Fibonacci retracement level of November 2021 to June 2022 price crash. Also, in close proximity to the 50 SMA on the Daily Price Chart (1,800).
- Price Target 1: 2,000 – Round number support/resistance level.
- Price Target 2: 2,141 – Price high of 16th April 2023.
- Stop Losses: < 1,705 – Region of the 100 SMA on the Daily Price Chart.
Risk Statement: Trading financial products carries a high risk to your capital, especially trading leverage products such as CFDs. They may not be suitable for everyone. Please make sure that you fully understand the risks. You should consider whether you can afford to take the risk of losing your money.

Forextraders' Broker of the Month
BlackBull Markets is a reliable and well-respected trading platform that provides its customers with high-quality access to a wide range of asset groups. The broker is headquartered in New Zealand which explains why it has flown under the radar for a few years but it is a great broker that is now building a global following. The BlackBull Markets site is intuitive and easy to use, making it an ideal choice for beginners.