
FOCUS ON: Debt Ceiling Talks and US Non-Farm Payrolls
- Progress made on US debt-ceiling talks triggers rally in stocks and USD
- There is still room for events at the Capitol to influence asset prices
- US Non-Farm Payroll jobs number due on Friday
Trading Ideas
We created this Weekly Tips section to share possible trade entry and exit points based on our technical analysis. We also have other methods to validate our trades which we can’t publicly share, that help to increase their success. All our trades include entry and at least one target price. Stop losses are applied at the reader’s discretion. Our strategies typically trade with a wide stop loss, and risk is further mitigated by trading in small sizes.
Instrument | Price | Hourly | Daily |
GBP/USD | 1.2343 | Strong Buy | Neutral |
EUR/USD | 1.0674 | Strong Buy | Strong Sell |
USD/JPY | 140.42 | Strong Sell | Strong Buy |
S&P 500 | 4,223 | Strong Buy | Strong Buy |
NASDAQ 100 | 14,375 | Strong Buy | Strong Buy |
FTSE100 | 7,615 | Sell | Strong Sell |
Gold | 1,935 | Strong Buy | Neutral |
Crude Oil WTI | 72.25 | Strong Sell | Strong Sell |
Bitcoin | 27,736 | Strong Buy | Strong Buy |
Ethereum | 1,898 | Strong Buy | Strong Buy |
UTC: 08:32
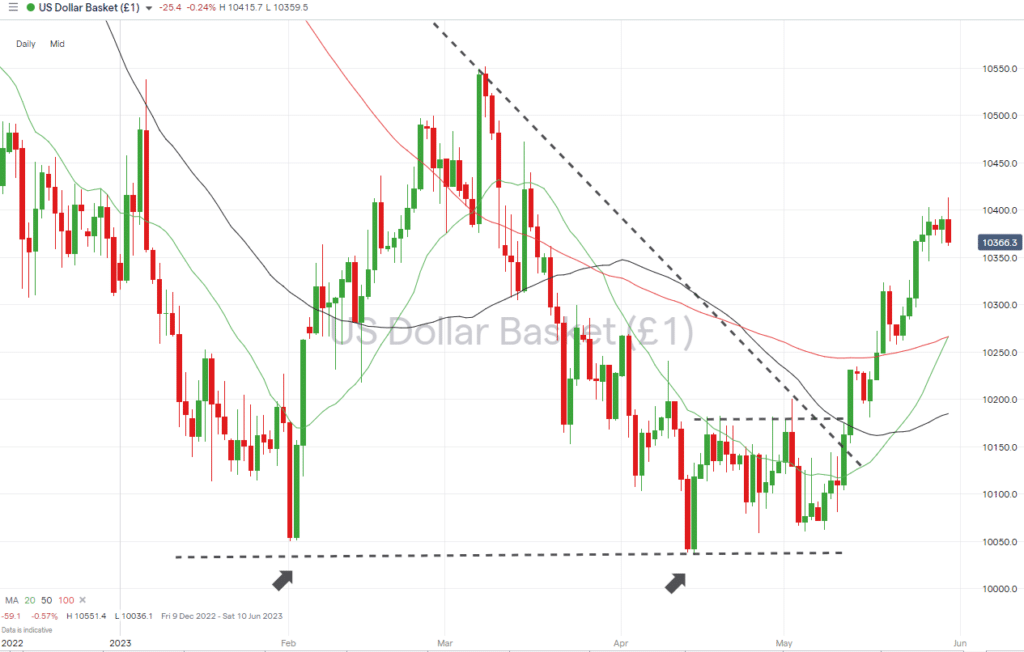
US Dollar Basket Index (DXY)
Dollar strength continues to track the progress made on the US debt-ceiling issue. President Joe Biden’s positive comments regarding the matter were accompanied by the greenback gaining ground against the euro, sterling, and Japanese yen. The week-on-week gain in USDJPY was 1.81%, with GBPUSD moving by -0.78% and EURUSD by -1.21%.
US Dollar Basket Chart – Daily Price Chart – Breakout of Descending Wedge Pattern
Source: IG
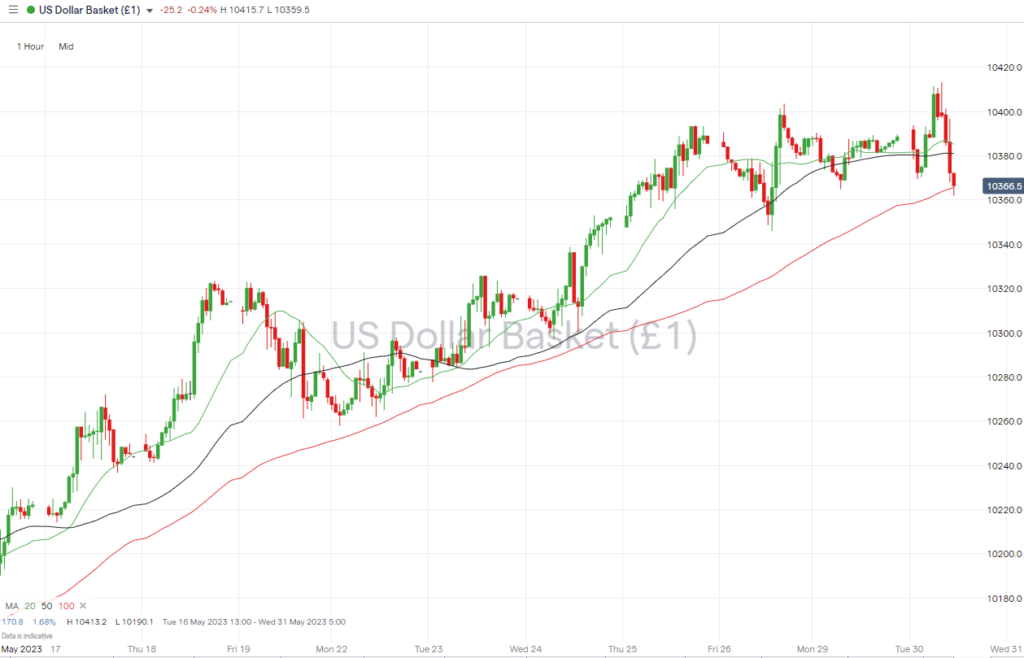
US Dollar Basket Chart – Hourly Price Chart
Source: IG
Short positions
- Entry Level 1: 104.13 – Intraday price high of Monday 30th May.
- Price Target 1: 102.67 – Three-way convergence. Region of the 20 SMA on the Weekly Price Chart and also 20 and 100 SMAs on the Daily Price Chart.
- Price Target 2: 101.81 – Swing-low price low of 16th May and region of 50 SMA on the Daily Price Chart.
- Stop Loss: > 104.13.
Long positions
- Entry Level 1: 103.65 – Region of the 100 SMA on the Hourly Price Chart has acted as support since Thursday 11th May.
- Price Target 1: 104.13 – Month to date price high.
- Price Target 2: 105.48 – Year to date price high recorded on 7th March.
- Stop Loss: < 102.66 – Region of the convergence of the 20 and 100 SMAs on the Daily Price Chart.
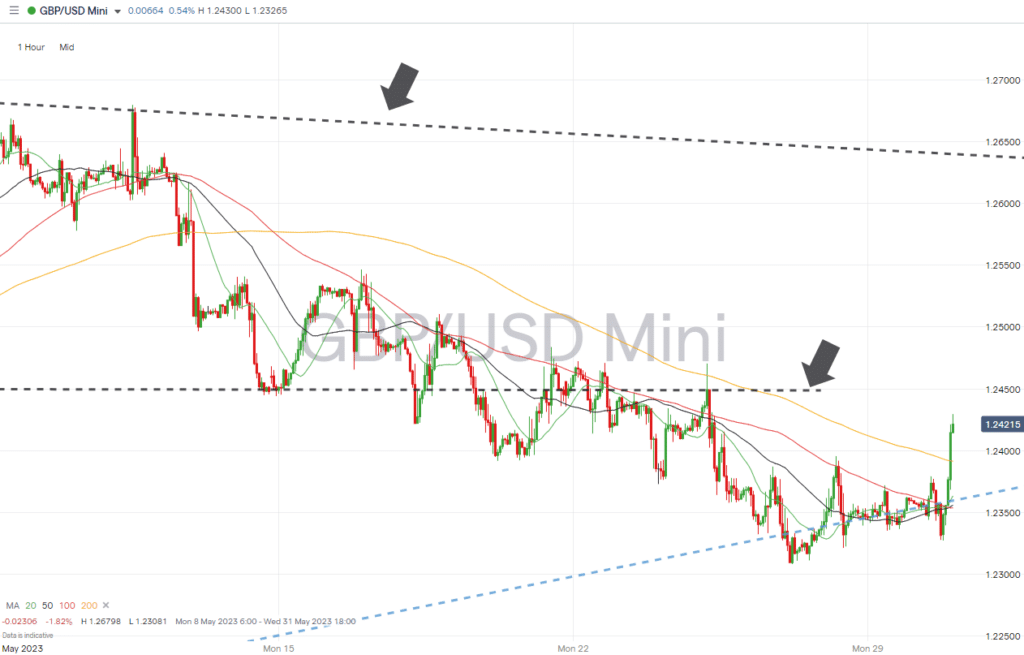
GBPUSD
Two technical indicators now point to further GBPUSD weakness. The first is the break of the long-term wedge pattern formed by the upper trendline of the downward price move, which started in June 2021, and the support level of 1.24480. The second is the move across the 50 SMA made by the 20 SMA on the Daily Price Chart.
Daily Price Chart – GBPUSD Chart – Daily Price Chart
Source: IG
GBPUSD Chart – Hourly Price Chart
Source: IG
Short positions
- Entry Level 1: 1.24470 – Resistance/support level dating back to the double-top price pattern formed in December 2022 and January 2023.
- Price Target 1: 1.23081 – Last week’s price low. Recorded on Tuesday 23rd May.
- Price Target 2: 1.18030 – In extension, swing-low price recorded on 8th March 2023.
- Stop Loss: > 1.24555 – Region of the 20 SMA on the Daily Price Chart.
Long positions
- Entry Level 1: 1.23917 – Region of 200 SMA on Hourly Price Chart. Previous month-to-date price low recorded on Thursday 18th May.
- Price Target 1: 1.24470 – Resistance/support level dating back to the double-top price pattern formed in December 2022 and January 2023.
- Price Target 2: 1.24724 – Price high of week beginning 22nd May.
- Stop Loss: < 1.23111 – Month to date price low.
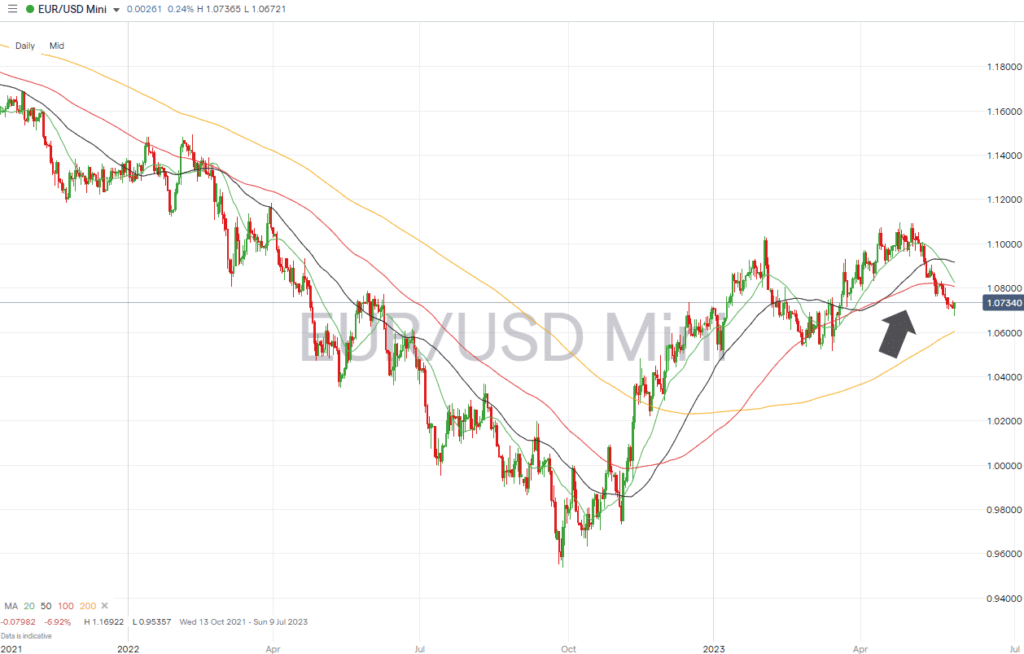
EURUSD
Despite exchanges being closed for national holidays on Monday, the coming week is set to be a busy one for Eurodollar traders. German and Eurozone inflation and jobs reports are due out, and the price of the EURUSD currency pair will also be influenced by the US Non-Farm Payroll numbers due on Friday.
Following eight consecutive down days, the outlook for EURUSD is decidedly bearish, but there is potential for retracements due to the market being oversold on a short-term basis.
EURUSD Chart – Daily Price Chart
Source: IG
EURUSD Chart – Hourly Price Chart
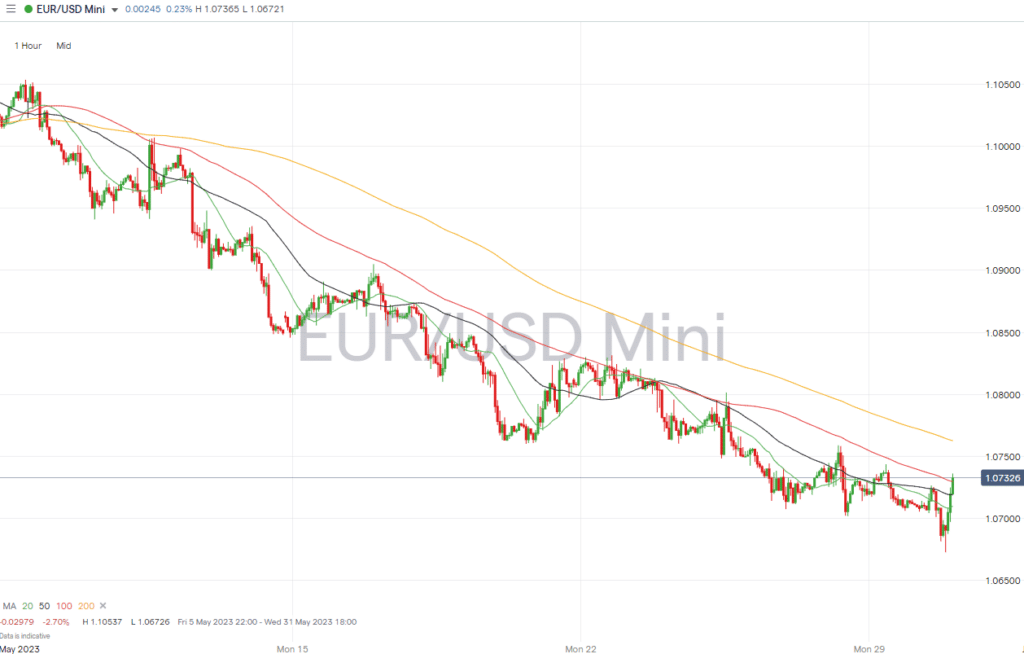
Source: IG
Short positions
- Entry Level 1: 1.07296 – 10 SMA on the Hourly Price Chart. Has guided the downward price move in EURUSD since 10th May.
- Price Target 1: 1.06726 – Intraday price low of 30th May.
- Stop Loss: > 1.08071 – Close to psychologically important ‘round number’ resistance of 108.00 and region of the 100 SMA on the Daily Price Chart.
Long positions
- Entry Level 1: 1.0736 –The 61.8% Fibonacci retracement of the price rise seen between 15th March and 4th May 2023.
- Price Target 1: 1.0807 – Region of the 100 SMA on the Daily Price Chart.
- Stop Loss: < 1.07133 – Swing-low price low of 24th March.
Indices
S&P 500
Positive news reports out of Washington last week left stock investors in a bullish mood. The S&P 500 ended the week up almost 1% but failed to confirm a significant break away from the 4195-resistance level, which marks the previous year-to-date high printed on 2nd February.
The US Non-Farm Payrolls number due on Friday could act as a catalyst for greater direction to come into the stock market.
S&P 500 Chart – Daily Price Chart – Wedge Pattern
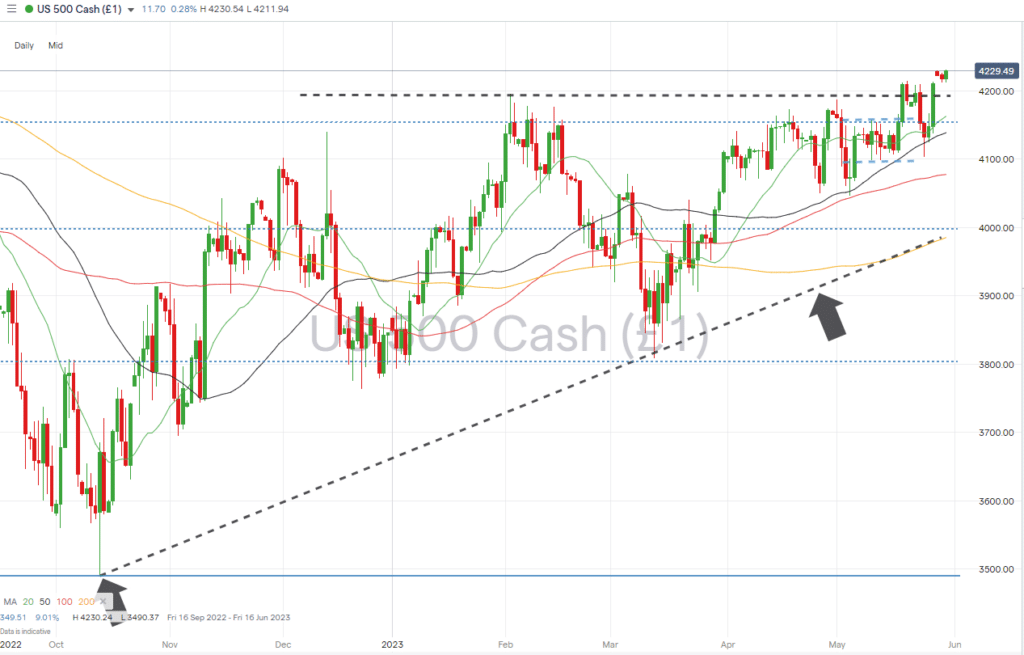
Source: IG
S&P 500 – Hourly Price Chart
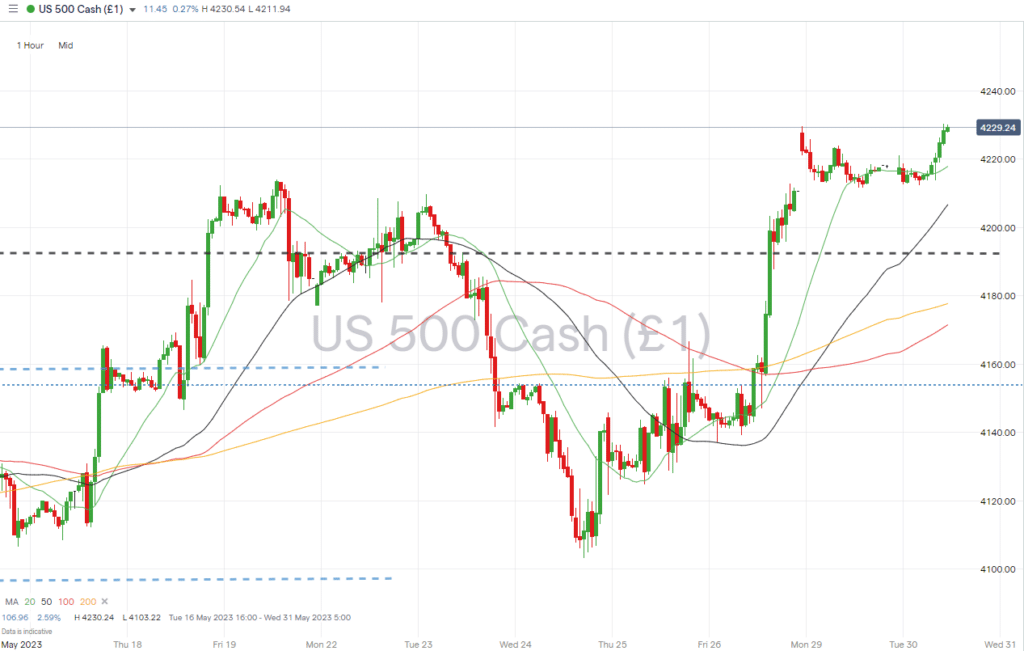
Source: IG
Short positions
- Entry Level 1: 4,195 – Previous year-to-date high printed on 2nd February. If price were to return to this level and break through to the downside, it would signal a build-up of downward price momentum.
- Price Target 1: 4,135 – Region of the 50 SMA on Daily Price Chart.
- Price Target 2: 4,046 – Price swing-low of 4th May sits just below the 100 SMA on the Daily Price Chart.
- Stop Loss: > 4,212 – Previous year-to-date price high recorded on 18th May.
Long positions
- Entry Level 1: 4,195 – Previous year-to-date high printed on 2nd February. Price tested and broke this level during last week’s trading, and providing a revisit to the level is temporary. It would provide an opportunity to buy into short-term weakness.
- Price Target 1: 4,310 – 61.8% Fibonacci retracement level of the price fall from 4th January to 13th October 2022.
- Stop Loss: < 4,162 – Region of the 20 SMA on Daily Price Chart.
Crypto – Bitcoin & Ethereum
The debt-ceiling stand-off might not have challenged the fiat-money system enough to trigger a rise in crypto prices, but nor has a resolution to the problem resulted in coins weakening. Bitcoin and Ethereum posted positive returns last week as they found support from the 100 SMA on the Daily Price Chart.
That key metric looks set to continue influencing price with some enthusiasm that coins will likely be driven by any increased concern about the viability of small and mid-range US banks and what their predicament could mean for the established financial system.
Bitcoin Price Chart – Daily Price Chart
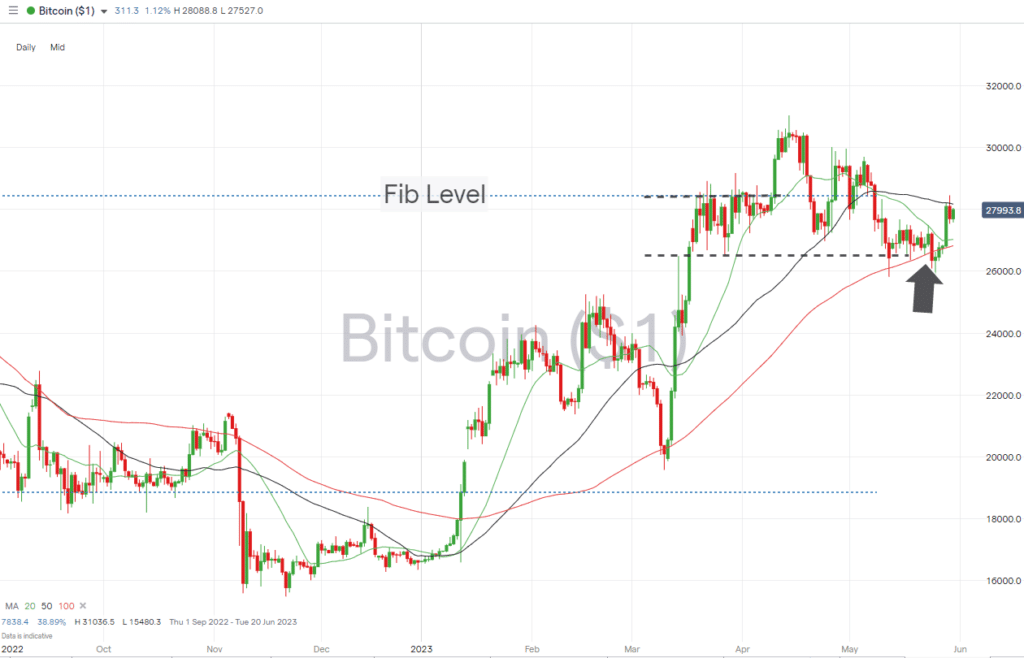
Source: IG
Bitcoin Long positions
- Entry Level 1: 27,015– Region of the 20 SMA on the Daily Price Chart.
- Price Target 1: 28,952 – Price level formed by the 61.8% Fib retracement of the upwards price move in Bitcoin recorded between February 2019 and November 2021.
- Price Target 1: 31,036 – In extension, year-to-date price high of 14th April.
- Stop Losses: < 25,829 – Intraday price low of Friday 12th May.
Ethereum
Ethereum Chart – Daily Price Chart
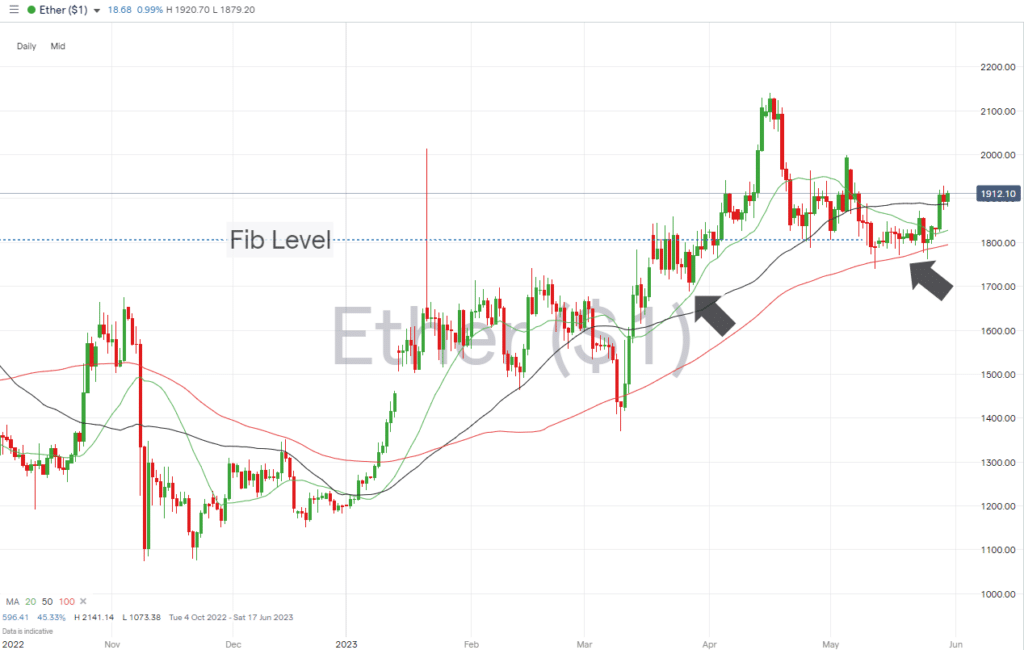
Source: IG
Ethereum Long positions
- Entry Level 1: 1,887 – Region of the 50 SMA on the Daily Price Chart.
- Price Target 1: 2,000 – Psychologically important round-number support/resistance level tested on 5th May.
- Price Target 2: 2,141 – In extension, year-to-date price high of 16th April.
- Stop Losses: < 1,806 – 23.6% Fibonacci retracement level of the November 2021 to June 2022 price fall.
Risk Statement: Trading financial products carries a high risk to your capital, especially trading leverage products such as CFDs. They may not be suitable for everyone. Please make sure that you fully understand the risks. You should consider whether you can afford to risk losing your money.

Forextraders' Broker of the Month
BlackBull Markets is a reliable and well-respected trading platform that provides its customers with high-quality access to a wide range of asset groups. The broker is headquartered in New Zealand which explains why it has flown under the radar for a few years but it is a great broker that is now building a global following. The BlackBull Markets site is intuitive and easy to use, making it an ideal choice for beginners.