
FOCUS ON: Build-up to ECB and Fed Rate Decisions
- Australian and Canadian central banks update markets on interest rate decisions this week.
- Move to ‘risk-on’ assets looks priced in.
- Consolidation possible in build-up to ECB and Fed rate decisions next week.
Trading Ideas
We created this Weekly Tips section to share possible trade entry and exit points based on our technical analysis. We also have other methods to validate our trades which we can’t publicly share that help to increase their success. All our trades include entry and at least one target price. Stop losses are applied at the reader’s discretion. Our strategies typically trade with a wide stop loss, and risk is further mitigated by trading in small sizes.
Instrument | Price | Hourly | Daily |
GBP/USD | 1.2398 | Strong Sell | Strong Sell |
EUR/USD | 1.0690 | Strong Sell | Strong Sell |
USD/JPY | 140.40 | Strong Buy | Strong Buy |
S&P 500 | 4,282 | Strong Buy | Strong Buy |
NASDAQ 100 | 14,524 | Strong Buy | Strong Buy |
FTSE100 | 7,641 | Strong Buy | Strong Buy |
Gold | 1,939 | Strong Sell | Strong Sell |
Crude Oil WTI | 73.27 | Strong Buy | Neutral |
Bitcoin | 27,138 | Sell | Neutral |
Ethereum | 1,902 | Buy | Buy |
UTC: 09:59
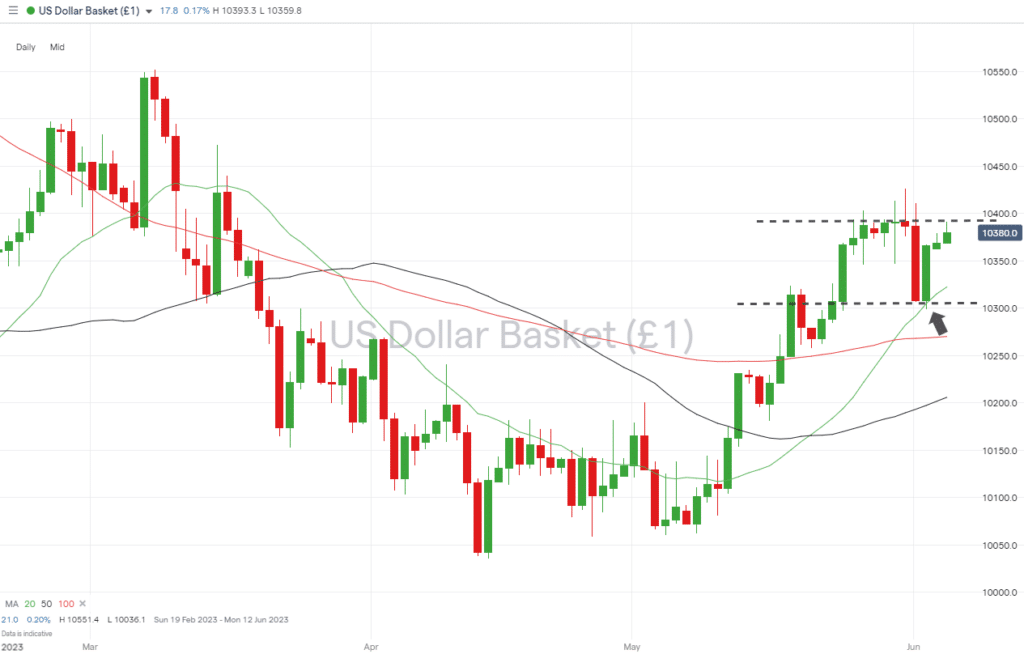
US Dollar Basket Index (DXY)
The US debt-ceiling issue has been resolved, and the once-a-month Non-Farm Payrolls jobs numbers have been released; neither has done much to give the US dollar more direction. The DXY basket index has failed to close below 103.08 or above 103.91 since 23rd May, and with a quieter news week ahead, further price consolidation within that range can’t be ruled out.
US Dollar Basket Chart – Daily Price Chart – Consolidation Pattern
Source: IG
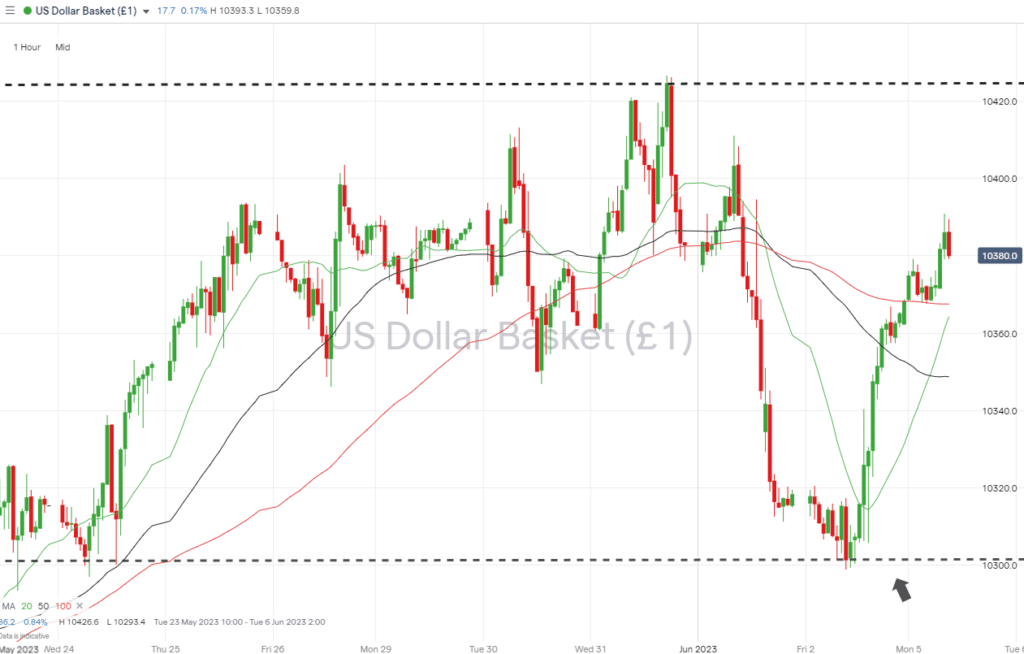
US Dollar Basket Chart – Hourly Price Chart
Source: IG
Short positions
- Entry Level 1: 103.91 – Closing price of Monday 30th May.
- Price Target 1: 103.48 – Region of the 50 SMA on the Hourly Price Chart.
- Price Target 2: 103.22 – Support level offered by 20 SMA on the Daily Price Chart. Price has failed to close below this metric since 10th May.
- Stop Loss: > 104.26 – Intraday price high and year-to-date high of 31st May.
Long positions
- Entry Level 1: 103.22 – Region of the 20 SMA on the Daily Price Chart. Price has failed to close below this metric since 10th May, and it provided significant support and caused a bounce in price when touched on 2nd June.
- Price Target 1: 103.91 – Closing price of Monday 30th May.
- Price Target 2: 104.26 – Year-to-date price high recorded on 31st May.
- Stop Loss: < 103.08 – Closing price of 1st June and bottom end of the two-week-long sideways trading channel.
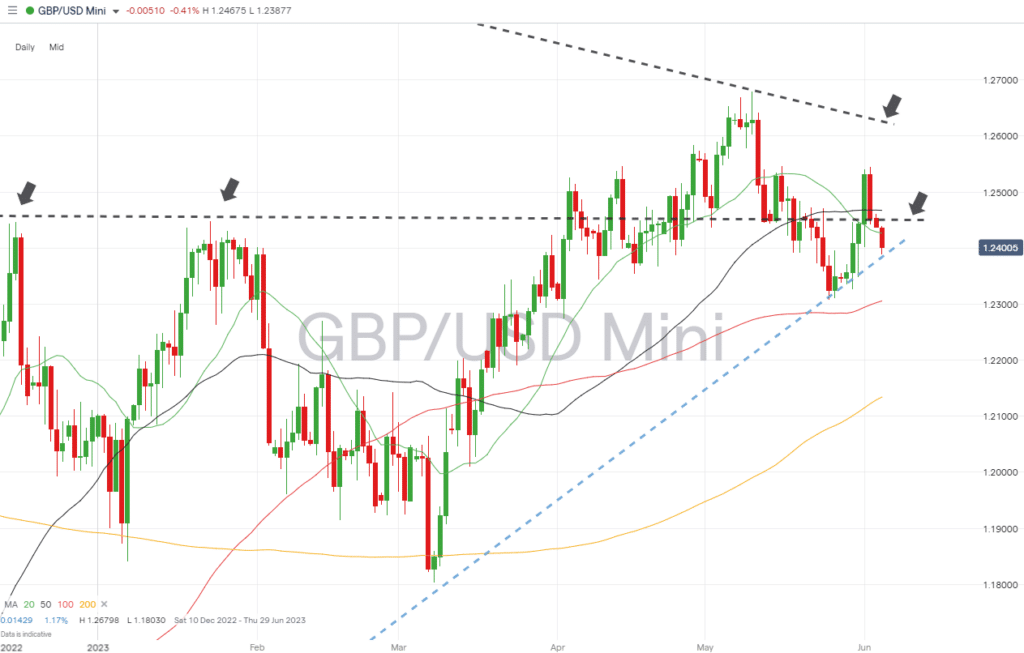
GBPUSD
Last week’s move above the 20 and 50 SMA’s on the Daily Price Chart was a failed breakout, and cable ended the week trading below those two key metrics. The price action has therefore resumed its bearish pattern, and a break of the supporting trendline dating back to 8th March would confirm the path of least resistance to be downward.
Daily Price Chart – GBPUSD Chart – Daily Price Chart
Source: IG
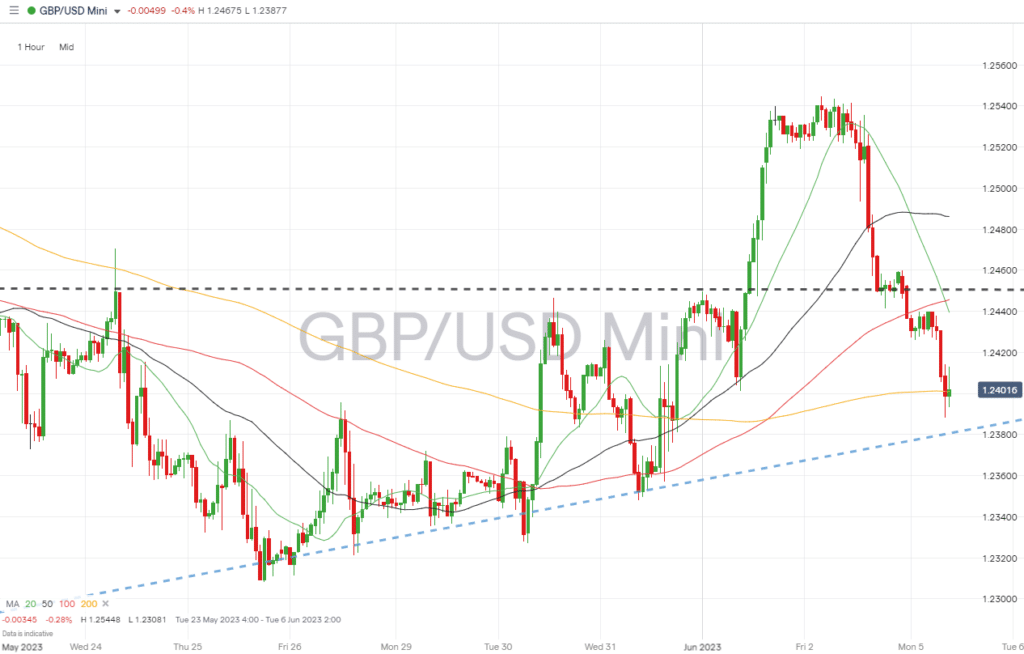
GBPUSD Chart – Hourly Price Chart
Source: IG
Short positions
- Entry Level 1: 1.23837 – A break of the supporting trendline dating back to March would open the door to downward momentum building.
- Price Target 1: 1.23059 – Region of the 100 SMA on the Daily Price Chart and the price low of 25th May (1.23081).
- Stop Loss: > 1.24268 – Region of the 20 SMA on the Daily Price Chart.
Long positions
- Entry Level 1: 1.24470 – Resistance/support level dating back to the double-top price pattern formed in December 2022 and January 2023. A break above this level would signal bullish momentum in the currency pair.
- Price Target 1: 1.25448 – Intra-day price high recorded on 2nd June.
- Price Target 2: 1.26798 – Year-to-date price high printed on 10th May. This sits above the downward trendline (1.26251), with the lower price level forming an alternative price target.
- Stop Loss: < 1.23837 – Region of the multi-month supporting trendline.
EURUSD
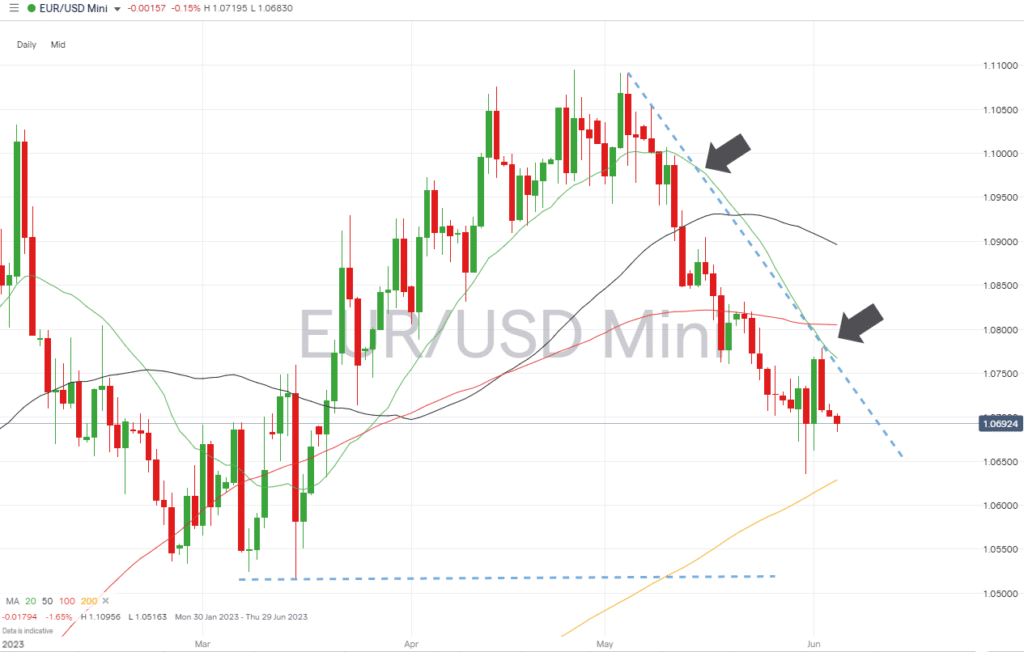
Softer-than-expected inflation numbers out of Europe last week continue to pressure the euro. The downward price move, which started on 4th May, has been guided by the 20 SMA on the Daily Price Chart. That remains the metric of choice for those looking for trade entry points which take advantage of further price falls.
EURUSD Chart – Daily Price Chart – Downwards Price Action
Source: IG
EURUSD Chart – Hourly Price Chart
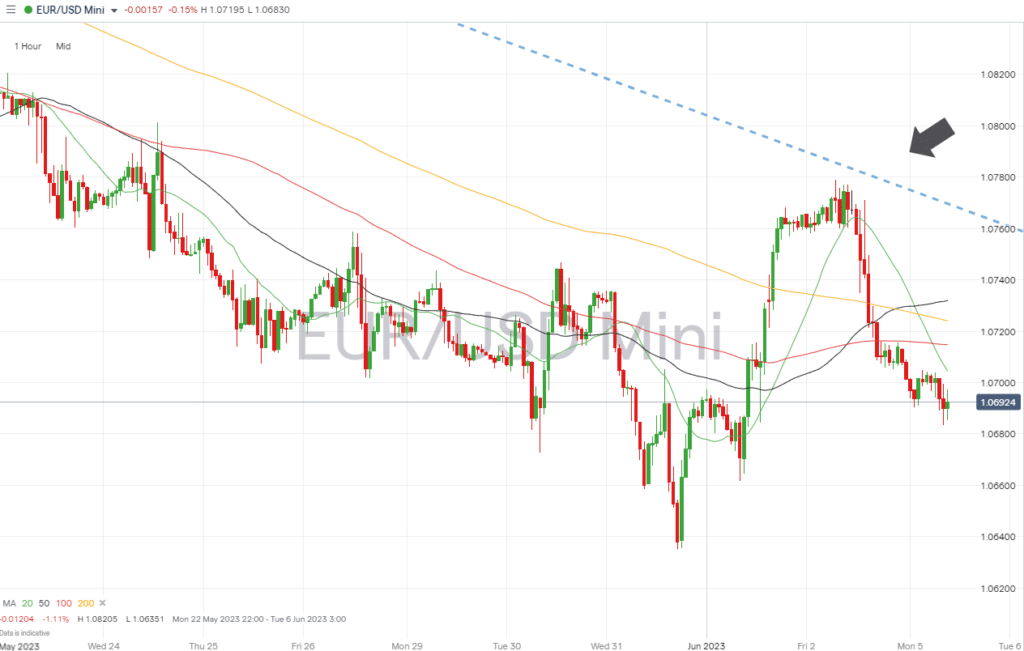
Source: IG
Short positions
- Entry Level 1: 1.07672 – Region of the 20 SMA on the Hourly Price Chart. Has guided the downward price move in EURUSD since 10th May.
- Price Target 1: 1.06351 – Intraday price low of 31st May.
- Price Target 2: 1.05163 – Low-price recorded on 15th March.
- Stop Loss: > 1.08051 – Close to psychologically important ‘round number’ resistance of 108.00 and region of the 100 SMA on the Daily Price Chart.
Long positions
- Entry Level 1: 1.06287 – 200 SMA on the Daily Price Chart. Price hasn’t traded in the region of this metric since November 2022, so it can be expected to offer some resistance.
- Price Target 1: 1.0736 –The 61.8% Fibonacci retracement of the price rise between 15th March and 4th May 2023.
- Price Target 2: 1.08051 – Region of the 100 SMA on the Daily Price Chart.
- Stop Loss: < 1.05163 – Swing-low recorded by the intraday price move of 15th March.
Indices
S&P 500
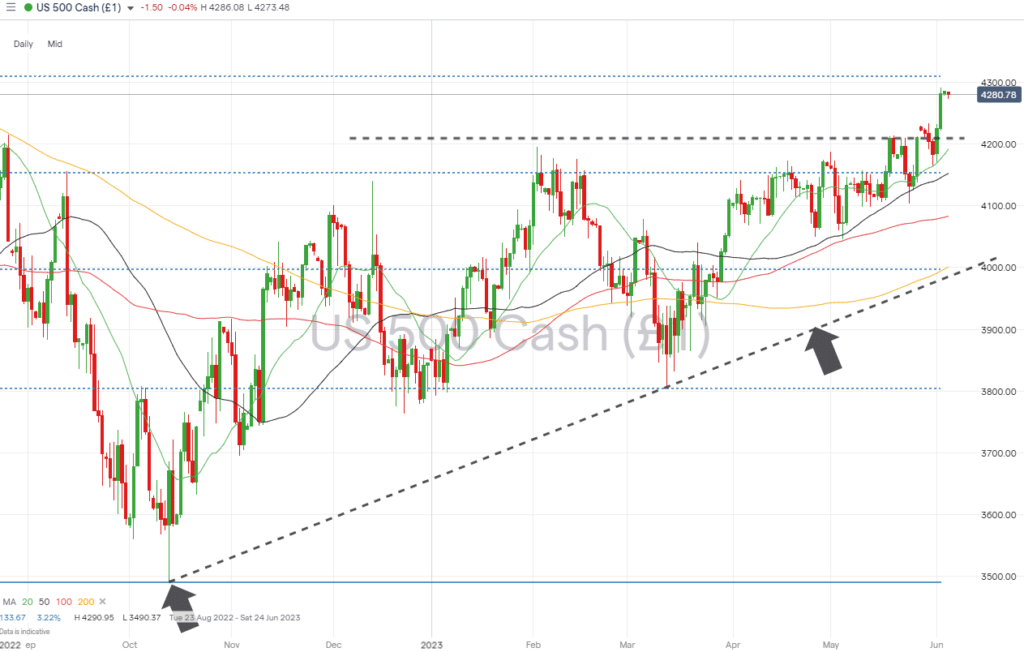
The US Non-Farm Payrolls number released on Friday beat analyst forecasts and pointed to the US labour market and economy showing surprising resilience. It also triggered a move above the resistance in the region of 4,200, which had capped upward price moves for the best part of two weeks.
S&P 500 Chart – Daily Price Chart
Source: IG
S&P 500 – Hourly Price Chart
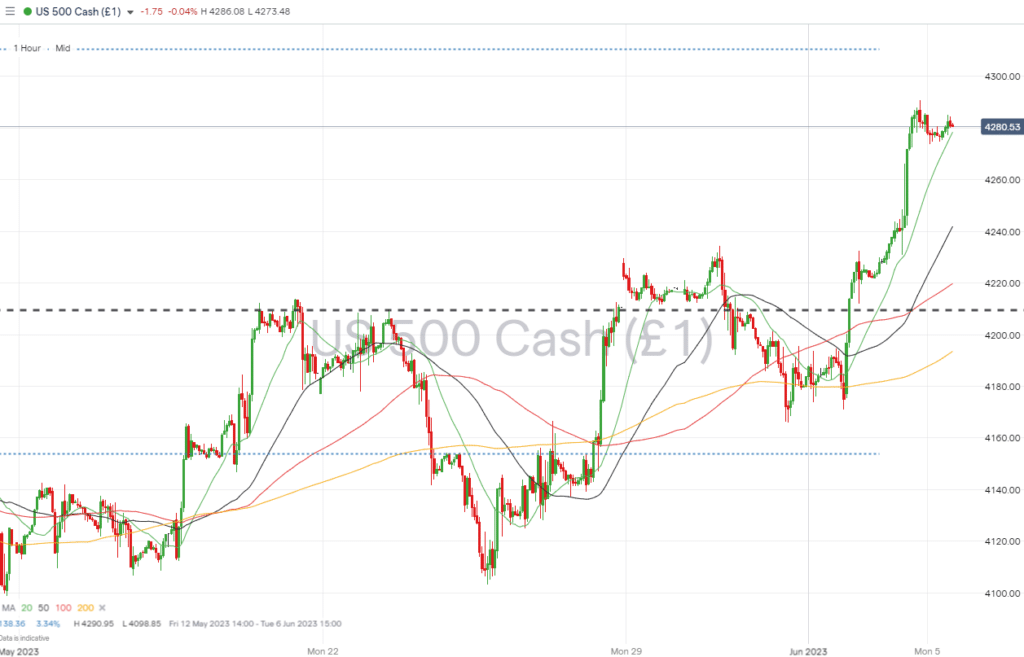
Source: IG
Short positions
- Entry Level 1: 4,310 – 61.8% Fibonacci retracement level of the price fall from 4th January to 13th October 2022.
- Price Target 1: 4,191 – Region of the 50 SMA on the Daily Price Chart and close to the previous year-to-date high printed on 2nd February (4195).
- Price Target 2: 4,149 – Region of the 50 SMA on the Daily Price Chart and 50% retracement level of the Jan-Oct 2022 Fib price pattern.
- Stop Loss: > 4,325 – Price high of 16th August 2022.
Long positions
- Entry Level 1: 4,195 – Buying into short-term weakness, which takes price back to the previous year-to-date high printed on 2nd February.
- Price Target 1: 4,310 – 61.8% Fibonacci retracement level of the price fall from 4th January to 13th October 2022.
- Stop Loss: < 4,191 – Region of the 20 SMA on Daily Price Chart.
Crypto – Bitcoin & Ethereum
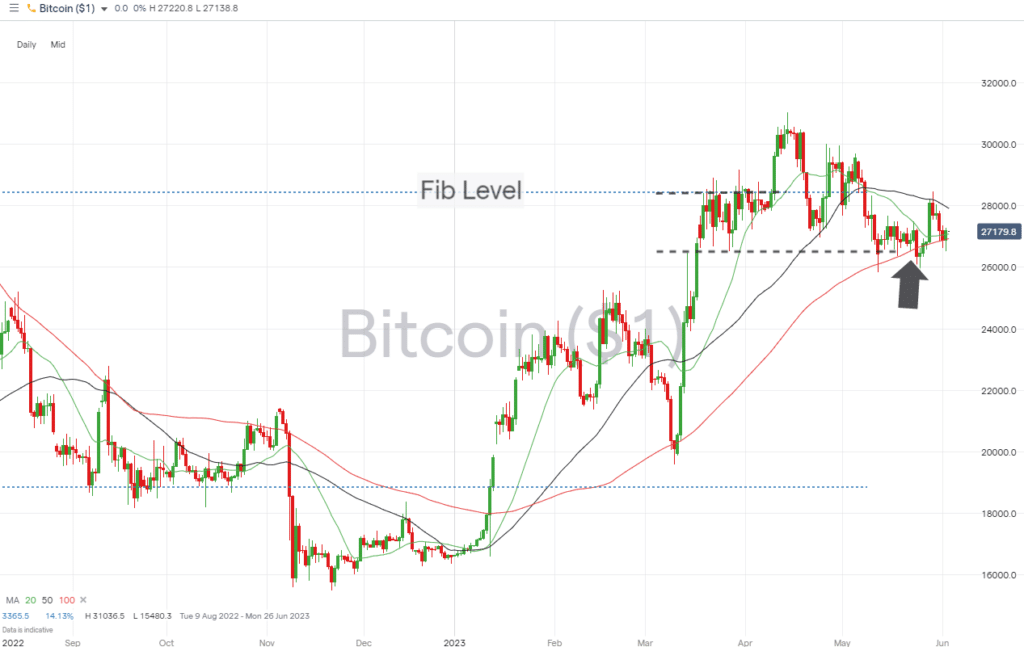
Both major cryptos made tentative upward moves last week and continue to trade at price levels above the key metric of the 100 SMA on the Daily Price Chart.
Bitcoin ended up posting a small week-on-week loss, but Ethereum’s 0.21% price gain highlights the level of support at current levels. From a fundamental analysis perspective, regulatory changes in China could act as a catalyst for further upward price moves.
Bitcoin Price Chart – Daily Price Chart
Source: IG
Bitcoin Long positions
- Entry Level 1: 26,901– Region of the 100 SMA on the Daily Price Chart.
- Price Target 1: 28,952 – Price level formed by the 61.8% Fib retracement of the upward price move in Bitcoin recorded between February 2019 and November 2021.
- Price Target 1: 31,036 – In extension, year-to-date price high of 14th April.
- Stop Losses: < 25,870 – Intraday price low of Friday 25th May.
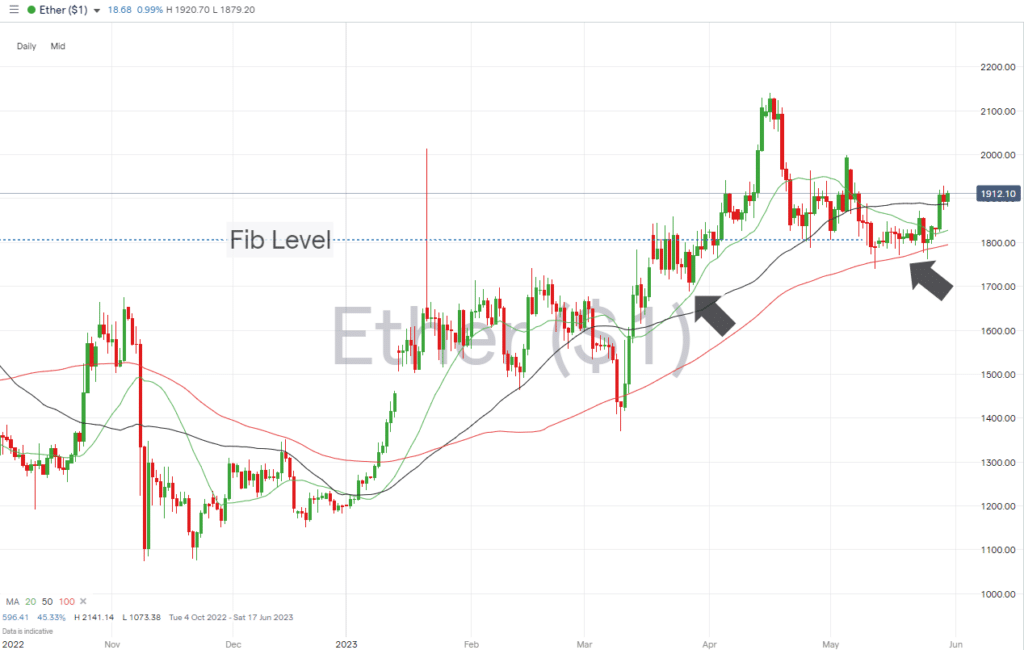
Ethereum
Ethereum Chart – Daily Price Chart
Source: IG
Ethereum Long positions
- Entry Level 1: 1,879 – Region of the 50 SMA on the Daily Price Chart.
- Price Target 1: 2,000 – Psychologically important ‘round number’ support/resistance level, which was tested on 5th May.
- Price Target 2: 2,141 – In extension, year-to-date price high of 16th April.
- Stop Losses: < 1,806 – 23.6% Fibonacci retracement level of the November 2021 to June 2022 price fall and region of 100 SMA on the Daily Price Chart (1.803).
Risk Statement: Trading financial products carries a high risk to your capital, especially trading leverage products such as CFDs. They may not be suitable for everyone. Please make sure that you fully understand the risks. You should consider whether you can afford to risk losing your money.

Forextraders' Broker of the Month
BlackBull Markets is a reliable and well-respected trading platform that provides its customers with high-quality access to a wide range of asset groups. The broker is headquartered in New Zealand which explains why it has flown under the radar for a few years but it is a great broker that is now building a global following. The BlackBull Markets site is intuitive and easy to use, making it an ideal choice for beginners.