
FOCUS ON: Trading Opportunities in a Busy News Week
- Three major central banks, the Fed, ECB and BoJ, will update on interest rate policy this week.
- There is uncertainty about whether the US Federal Reserve will raise rates again.
- The US CPI inflation report due on Tuesday could throw up surprises.
Trading Ideas
We created this Weekly Tips section to share possible trade entry and exit points based on our technical analysis. We also have other methods to validate our trades which we can’t publicly share that help to increase their success. All our trades include entry and at least one target price. Stop losses are applied at the reader’s discretion. Our strategies typically trade with a wide stop loss, and risk is further mitigated by trading in small sizes.
Instrument | Price | Hourly | Daily |
GBP/USD | 1.2578 | Strong Sell | Strong Sell |
EUR/USD | 1.0748 | Strong Sell | Strong Sell |
USD/JPY | 139.54 | Strong Buy | Strong Buy |
S&P 500 | 4,311 | Strong Buy | Strong Buy |
NASDAQ 100 | 14,594 | Strong Buy | Strong Buy |
FTSE100 | 7,575 | Strong Buy | Strong Buy |
Gold | 1,960 | Strong Sell | Strong Sell |
Crude Oil WTI | 69.31 | Strong Buy | Neutral |
Bitcoin | 22,799 | Sell | Neutral |
Ethereum | 1,737 | Buy | Buy |
UTC: 09:11
US Dollar Basket Index (DXY)
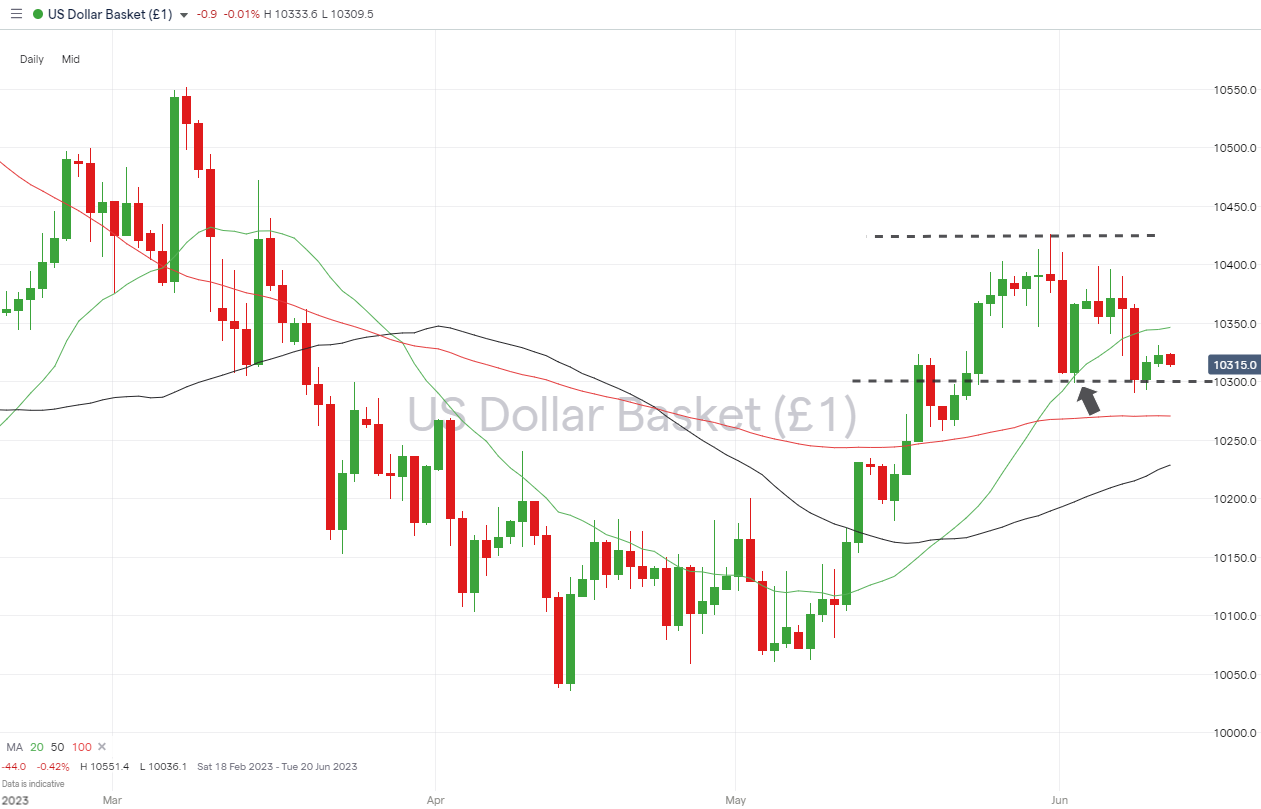
Last week, weakness in the US dollar reflected the growing opinion that the US Federal Reserve would hold off from hiking interest rates when it meets on Wednesday. That approach could be scuppered by the US CPI inflation report to be released on Tuesday. If that is hotter than forecast, increased volatility in USD currency pairs can be expected.
The fall in value, which took place after Tuesday 6th June, was halted by the 102.98 support level identified in this report, and which looks likely to provide further support going forward.
US Dollar Basket Chart – Daily Price Chart – Support Level Holds
Source: IG
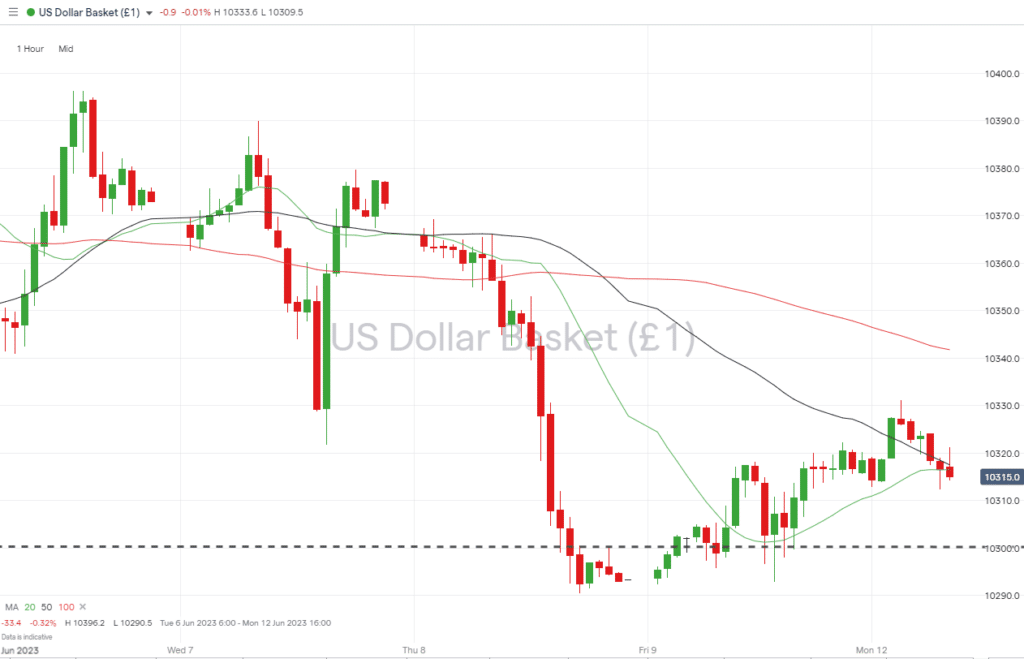
US Dollar Basket Chart – Hourly Price Chart
Source: IG
Short positions
- Entry Level 1: 102.90 – The value of the US dollar basket index has been declining through June, and a break of the new month-to-date price low of 102.90 would open the door to further downward price movement.
- Price Target 1: 102.70 – Region of the 100 SMA on the Hourly Price Chart.
- Price Target 2: 102.28 – Support level formed by 50 SMA on the Daily Price Chart. Price has failed to close below this metric since 11th May.
- Stop Loss: > 103.46 – Region of the 20 SMA on the Daily Price Chart.
Long positions
- Entry Level 1: 103.02 – Closing price of Thursday 8th June, which sits just above the intraday price lows of 102.98 recorded on 2nd June and 102.92 on Friday 9th June.
- Price Target 1: 103.46 – Region of 20 SMA on the Daily Price Chart.
- Price Target 2: 104.26 – Year-to-date price high recorded on 31st May.
- Stop Loss: < 102.70 – 100 SMA on the Daily Price Chart.
GBPUSD
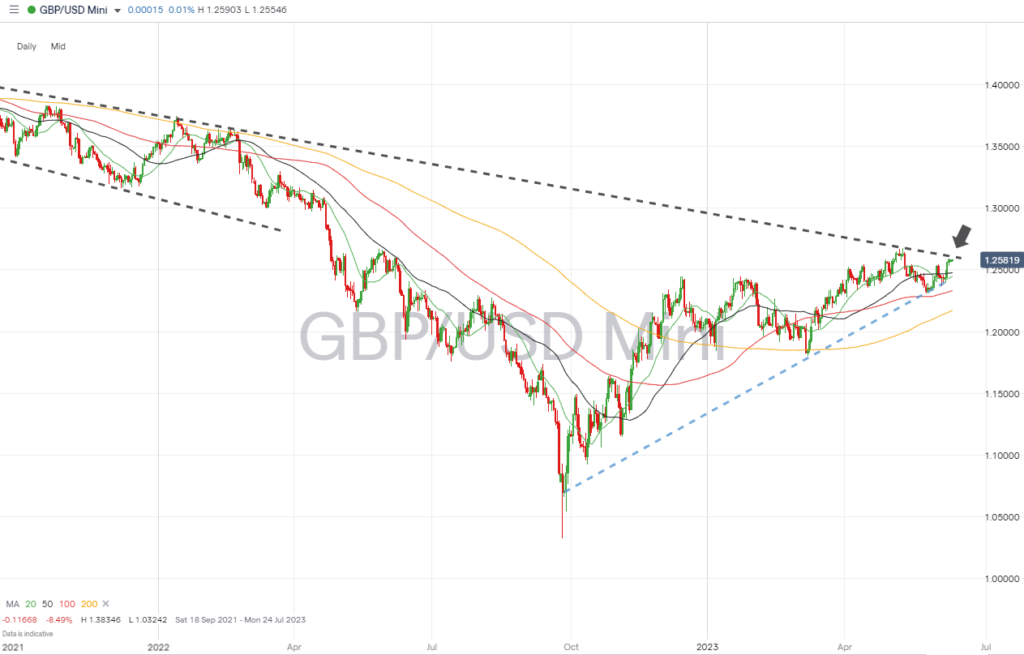
UK unemployment data will be released on Tuesday and will shed more light on whether a period of stagflation might arise to threaten the economy. Any sign that the jobs market is holding up would provide room for the Bank of England to raise interest rates further and trigger a break of the long-term downward trendline, which dates back to Q1 of 2022.
Daily Price Chart – GBPUSD Chart – Daily Price Chart – Trendline Break?
Source: IG
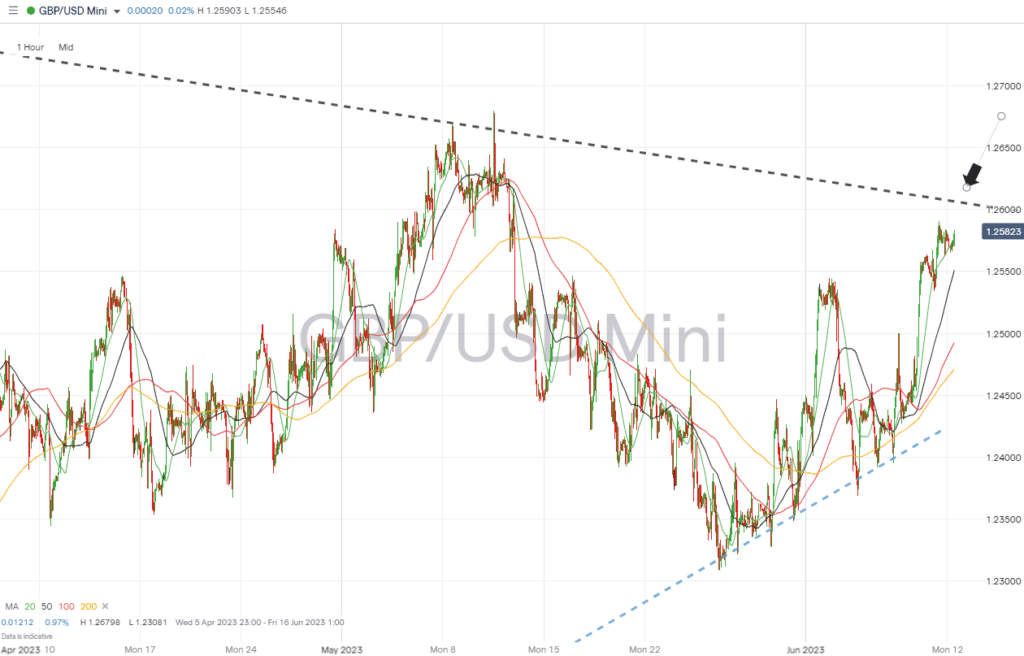
GBPUSD Chart – Hourly Price Chart
Source: IG
Short positions
- Entry Level 1: 1.2600 – Region of the resistance trendline on the Daily Price Chart. A break of this level is far from guaranteed as it has capped upward price moves since Q1 of 2022 and could do again.
- Price Target 1: 1.25760 – Region of the 20 SMA on the Hourly Price Chart.
- Price Target 2: 1.25283 – Support level marked by opening/closing prices of 13th, 14th April; 15th, 16th May; and 1st, 2nd June.
- Stop Loss: > 1.26798 – Price high of 10th May. The point at which price touched the resistance trendline before retreating.
Long positions
- Entry Level 1: 1.2600 – Applying a momentum-based strategy should price break the long-term resistance trendline.
- Price Target 1: 1.26798 – Year-to-date price high of 10th May.
- Price Target 2: 1.28539 – The 23.6% Fibonacci retracement level of the multi-year downward price move from November 2007 to September 2022.
- Stop Loss: < 1.2600.
EURUSD
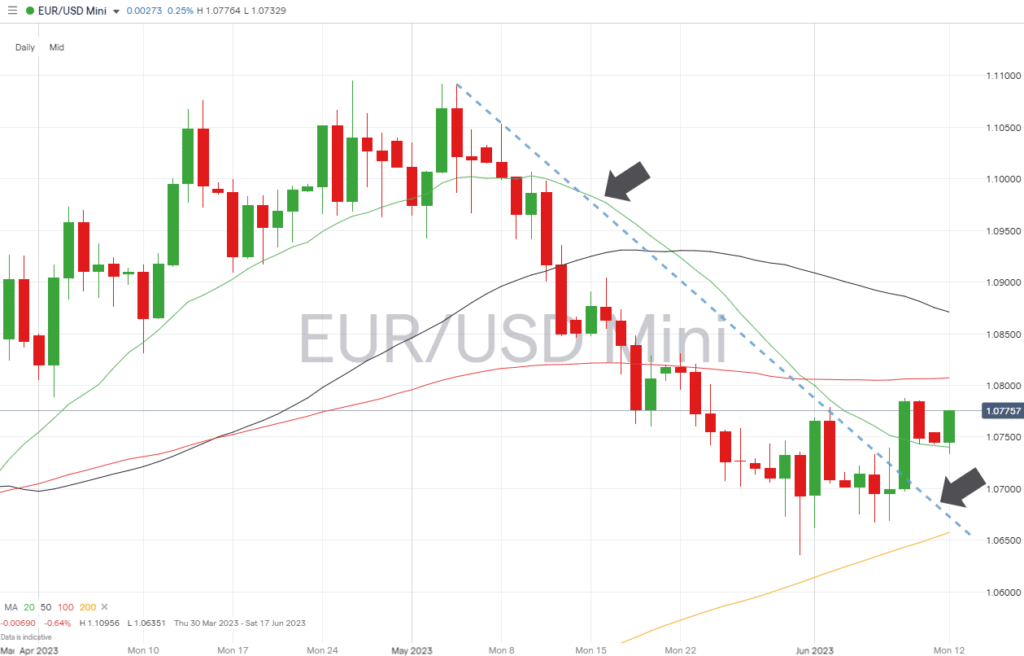
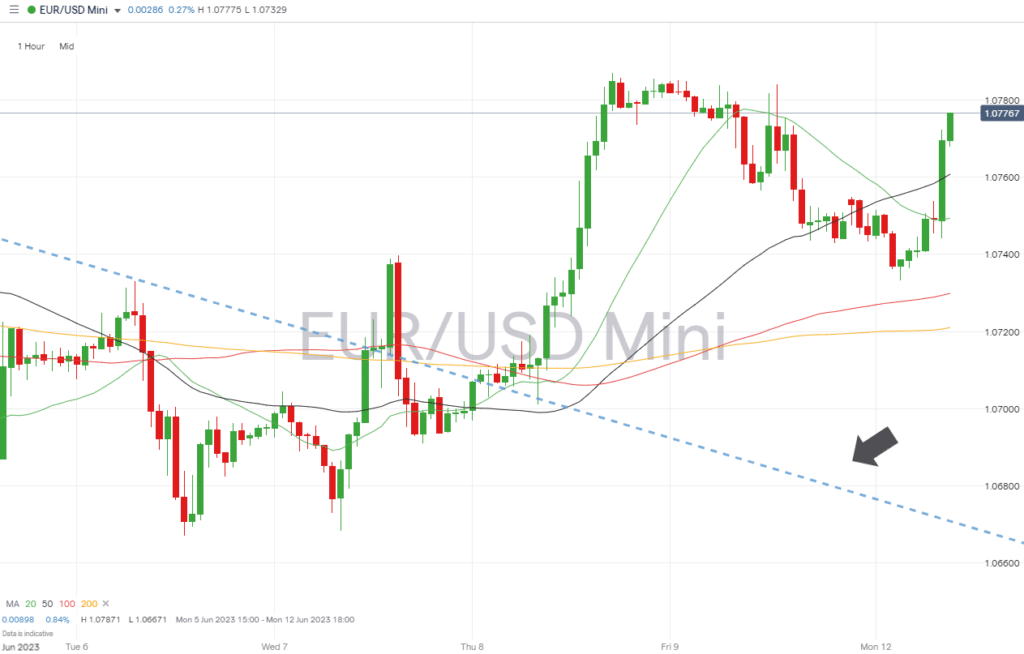
Analysts predict the ECB will raise interest rates when it meets on Thursday. The short-term rally in EURUSD, which started on 31st May, suggests some of that interest rate effect is already priced in, but with the Federal Reserve expected to hold off on increasing US interest rates and the downward trendline on the Daily Price Chart broken, there is still room for further upward price movement.
EURUSD Chart – Daily Price Chart – Downwards Price Action
Source: IG
EURUSD Chart – Hourly Price Chart
Source: IG
Short positions
- Entry Level 1: 1.07875 – June month-to-date price high printed on Thursday 8th June.
- Price Target 1: 1.07402 – Region of 20 SMA on the Daily Price Chart.
- Price Target 2: 1.06574 – Support marked by intraday price lows of 1st, 6th, and 7th June and region of the 200 SMA on the Daily Price Chart.
- Stop Loss: > 1.08073 – Close to psychologically important ‘round number’ resistance of 108.00 and region of the 100 SMA on the Daily Price Chart.
Long positions
- Entry Level 1: 1.07401 – Region of the 20 SMA on the Daily Price Chart. Had guided the downward price move in EURUSD between 10th May and 7th June and could now act as support.
- Price Target 1: 1.08096 – Region of the 100 SMA on the Daily Price Chart, and 38.2% Fibonacci retracement level of the price fall between 4th and 31st May.
- Price Target 2: 1.08635 – Convergence of the 50 SMA on the Daily Price Chart (1.08710) and the 50% Fib retracement of the May price fall.
- Stop Loss: < 1.06351 – Swing-low price point recorded by the intraday price move of 31st May.
Indices
S&P 500
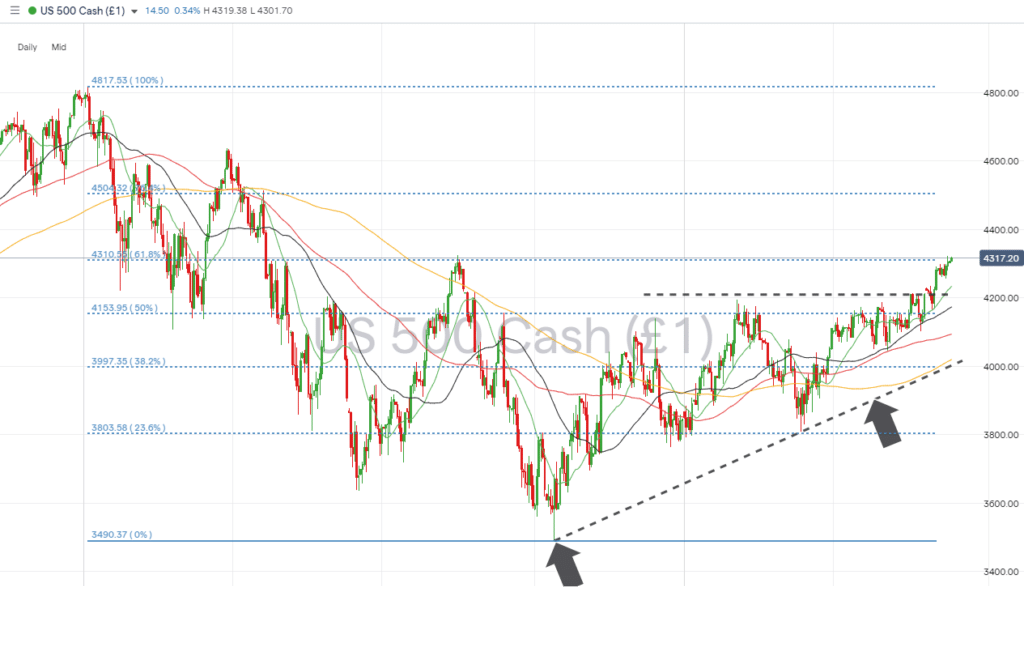
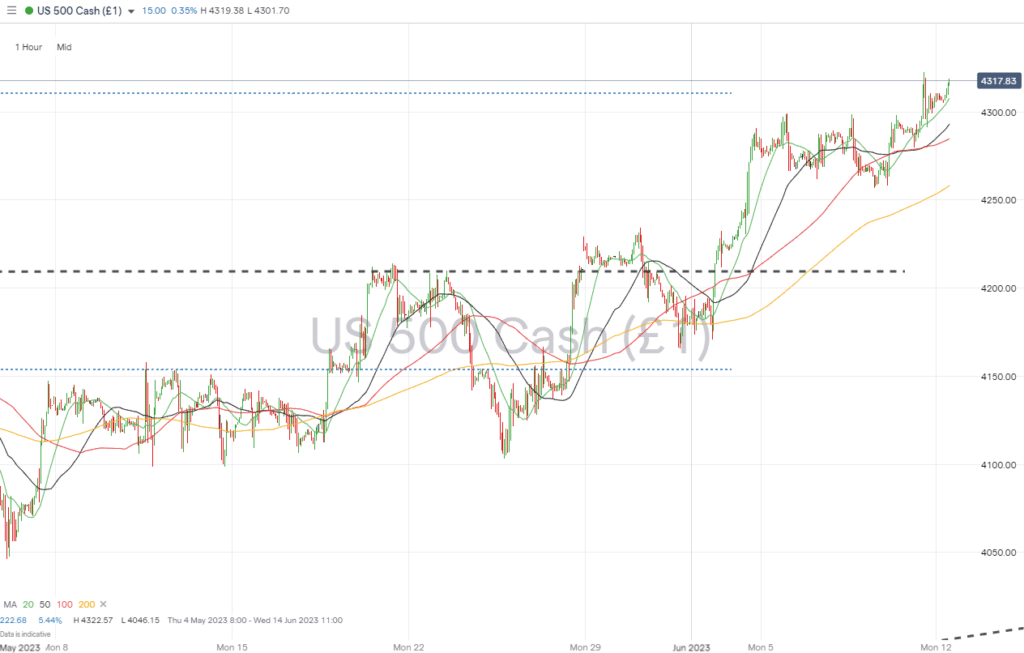
With inflation and interest announcements due out this week, an uptick in stock price volatility can be expected. The S&P 500 has spent a period of weeks testing key price levels, which would confirm that a new bull market has formed and underlying momentum still points to further upward price moves.
S&P 500 Chart – Daily Price Chart
Source: IG
S&P 500 – Hourly Price Chart
Source: IG
Short positions
- Entry Level 1: 4,310 – 61.8% Fibonacci retracement level of the price fall from 4th January to 13th October 2022.
- Price Target 1: 4,173 – Region of the 50 SMA on the Daily Price Chart and 50% retracement level of the Jan-Oct 2022 Fib price pattern (4153).
- Price Target 2: 4,019 – Region of the 200 SMA on the Daily Price Chart and supporting upward trendline, which started on 13th October 2022.
- Stop Loss: > 4,325 – Price high of 16th August 2022.
Long positions
- Entry Level 1: 4,234 – Buying into short-term weakness, which takes price back to the 20 SMA on the Daily Price Chart.
- Price Target 1: 4,322 – June month-to-date price high printed on Friday 9th June.
- Stop Loss: < 4,153 – Region of the 50 SMA on the Daily Price Chart and 50% Fib retracement support/resistance price level of 4,173.
Crypto – Bitcoin & Ethereum
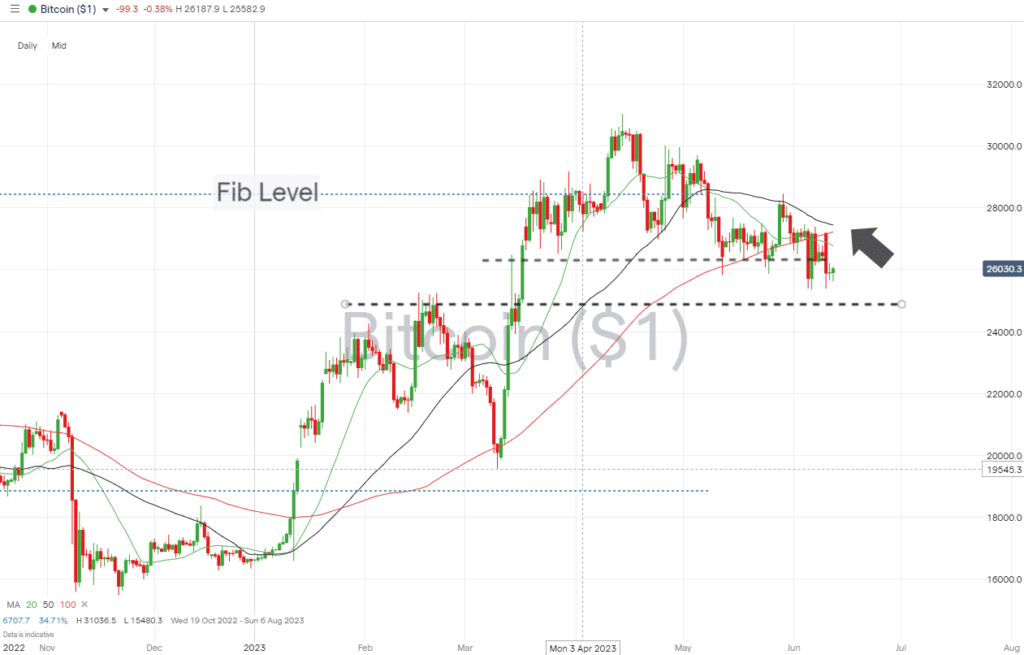
Both major cryptos posted negative returns last week. News that the broker Robinhood plans to delist Cardano, Solana, and Polygon was followed by investors dumping those coins. They experienced 30% price falls, but Ethereum and Bitcoin also felt the effects.
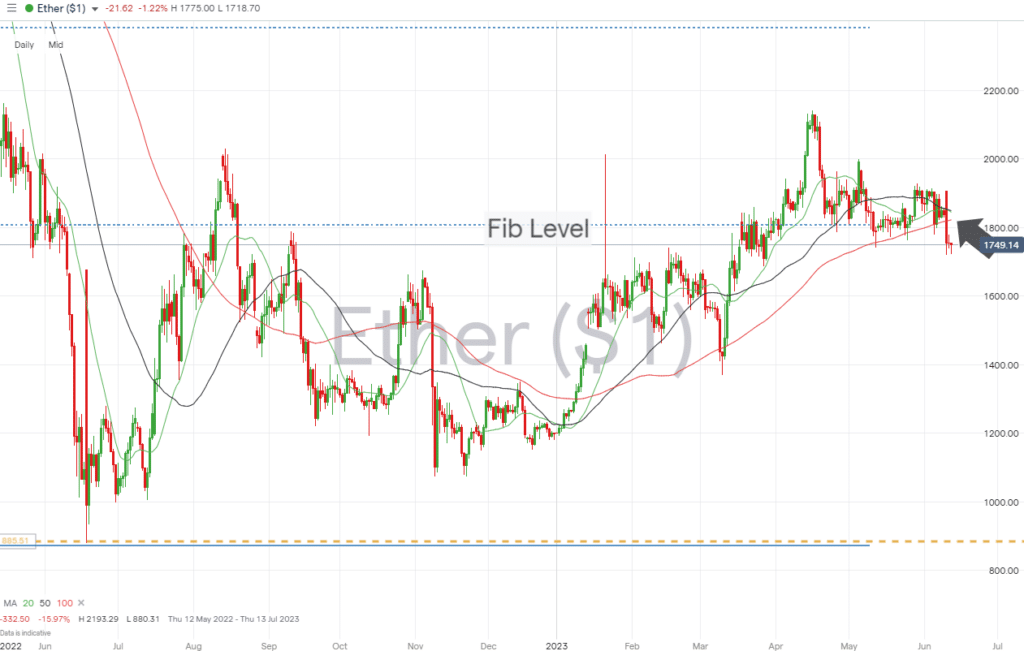
ETH and BTC experienced week-on-week price falls of 8.68% and 4.93%, respectively and are now trading below their 100 SMAs on the Daily Price Chart. That metric had provided support over recent weeks and can now be expected to resist upward price moves.
Bitcoin Price Chart – Daily Price Chart
Source: IG
Bitcoin Long positions
- Entry Level 1: 25,359 – Month-to-date price low printed on Tuesday 6th June.
- Price Target 1: 27,223 – Region of the 100 SMA on the Daily Price Chart, just below the 50 SMA, which sits at 27,444.
- Price Target 2: 31,036 – In extension, year-to-date price high of 14th April.
- Stop Losses: < 24,933 – Support offered by swing-low price pattern formed between 16th and 22nd February. Sits just below the psychologically important $25,000 price level.
Ethereum
Ethereum Chart – Daily Price Chart
Source: IG
Ethereum Long positions
- Entry Level 1: 1,625 – Region of the 200 SMA on the Daily Price Chart.
- Price Target 1: 1,822 – The 100 SMA on the Daily Price Chart formerly offered support and can now be expected to act as resistance.
- Price Target 2: 2,000 – Psychologically important ‘round number’ support/resistance level, which was tested on 5th May.
- Price Target 3: 2,141 – In extension, the year-to-date price high printed on 16th April.
- Stop Losses: < 1,370 – Swing-low price level printed on 10th March.
Risk Statement: Trading financial products carries a high risk to your capital, especially trading leverage products such as CFDs. They may not be suitable for everyone. Please make sure that you fully understand the risks. You should consider whether you can afford to risk losing your money.

Forextraders' Broker of the Month
BlackBull Markets is a reliable and well-respected trading platform that provides its customers with high-quality access to a wide range of asset groups. The broker is headquartered in New Zealand which explains why it has flown under the radar for a few years but it is a great broker that is now building a global following. The BlackBull Markets site is intuitive and easy to use, making it an ideal choice for beginners.