- Long-term trends dominated forex markets in 2022
- 2023 could see more of the same
- Key support/resistance price levels in US Dollar Basket index (DXY) are coming into play
The largest forex market in the world has had a tumultuous 2022. Eurodollar traders endured a multi-month rally in the greenback, which stretched from February to September and was followed by a dramatic reversal. In many respects, it’s been a classic play, reflecting the underlying strength of the US and Eurozone economies, but the question it raises is what lies in store in 2023.
US Dollar / EURUSD – Six-Month Predictions
Any forecast for the US dollar in 2023 starts with an assessment of the eye-watering events of 2022. In September, the dollar posted a 20-year high against all other major currencies as it surged to 114.10 on the US Dollar Basket (DXY) index.
That represented a 14% price increase in the year. The British pound and the Japanese yen were the biggest losers, losing 11.63% and 22.38% in relative terms. But the peak-to-trough slide in the euro’s value was also 8.87%.
US Dollar Basket index – Daily Price Chart 2022
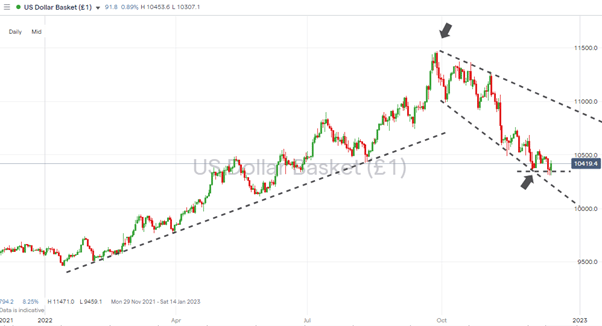
Source: IG
Also read: What is the USD Index?
The move was driven by the US Federal Reserve adopting a more aggressive approach to interest rate rises than its peers. Surging global inflation, at a 40-year high in the US, prompted the Fed to adopt the most hawkish tones. Additional support for the dollar came from investors who appreciate the greenback’s role as an anti-cyclical currency – one able to hold its value during an economic downturn.
Traders with a medium to long-term view need to factor in the likelihood that inflation may have already been beaten. Certain price levels to watch out for in 2023 could help them establish if the market thinks that is the case.
US Dollar Support and Resistance Levels
Huge support for the DXY index can be found in the region of 102.08, which is the 50% Fibonacci retracement of the price rally from May 2021 to September 2022. The 105.04 price level, which marks the 38.2% Fib retracement price level, put up a good enough fight against further falls in November that the 50% level looks sure to prove a significant pivot point.
US Dollar Basket index – Daily Price Chart 2022 – Fib Retracement
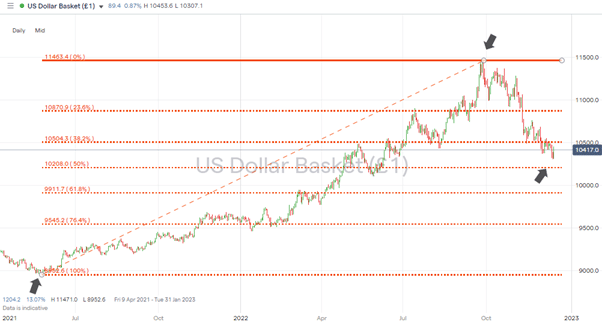
Source: IG
Those who see the dollar strengthening will note that a range of moving averages obstructs upward price moves. On the Daily Price Chart, the 20, 50, and 100 SMAs sit at 104.83, 107.57, and 109.11. But a break of those leaves a clear run to the 2022 price high of 114.63.
If you have been the victim of a scam, suspect fraudulent behaviour, or want to know more about this topic, please contact us at [email protected]
 Your capital is at risk
  Your capital is at risk