
In a relatively quiet news week, Monday’s market headlines were dominated by the bond markets. Fixed-income assets may be associated with lower price volatility. Still, the messages the sometimes sedate price moves send out can lead to far more dramatic price moves in other instruments. One question is whether the fall in the price of bonds and the increase in their yields will mark a rotation out of growth stocks into other sectors.
Vanguard ETF Hourly Chart – Bond Prices Down and Yields Up
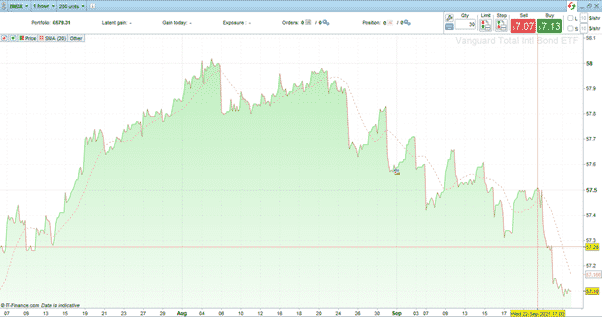
Source: IG
The fundamental analysis textbooks suggest that the move in bond yields could signify that inflation is becoming a significant threat to the financial system. The appetite for holding bonds with fixed maturity rates diminishes as inflationary pressure results in cash balances benefiting from higher bank interest rates. This rotation from bonds to cash is a localised move, and it doesn’t distort other markets too much. The thing that is spooking some equity investors is that the bond guys often make the right call and do it earlier than the analysts in stock markets.
If inflation is on the way, that’s bad news for stocks and growth stocks such as those found in the Nasdaq 100. The potential for rotation from that index into more cyclical stocks such as those found in the S&P 500 and Dow Jones Industrial Average could be down to technical as well as fundamental factors. Either way, it suggests a short-term move between the different sectors could be on the cards.
The chart below compares the relative performance of the three major US equity indices since March 2020 and highlights the outperformance of the Nasdaq. It rallied harder than the S&P 500 and DJIA thanks to ‘the new way of doing things’ being good for the innovative firms, which make up a more significant percentage of the Nasdaq. Even without the bond market news, the spread between the three indices is currently as wide as it has been for more than a year. At the previous times that the divergence reached these levels (2nd Sep 2020 and 3rd Feb 2021), there was a rotation out of the Nasdaq.
S&P 500 – Nasdaq 100 – DJIA. 18-month price chart showing divergence
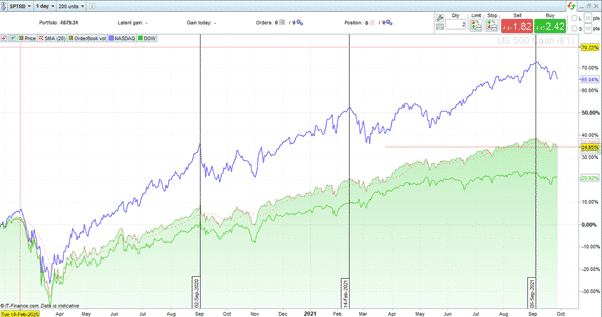
Source: IG
Nasdaq – blue; DJIA – green; S&P 500 / SPTRD – mountain
Taking the same chart over a shorter timeframe, from August 2020, illustrates that the divergence has repeatedly and consistently broken down. There are four periods where all three indices traded in line, and from a purely charting point of view, it looks like another convergence could be long overdue.
S&P 500 – Nasdaq 100 – DJIA. 14-month price chart showing convergence points
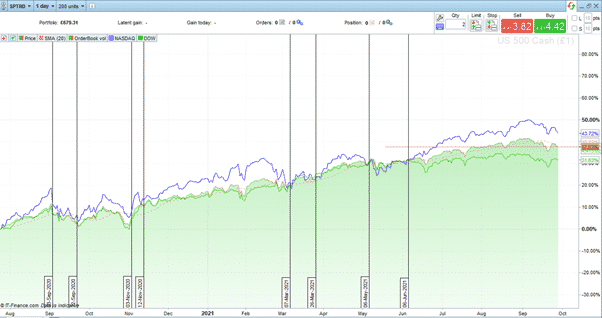
Source: IG
Nasdaq – blue; DJIA – green; S&P 500 / SPTRD – mountain
The bond desks might be the home of the smartest guys in the room, but the possible rotation is backed up by technical equity indicators as well as economic fundamentals.
If you have been the victim of a scam, suspect fraudulent behaviour, or want to know more about this topic, please contact us at [email protected]
 Your capital is at risk
  Your capital is at risk