
- Fed’s 75 basis point rate hike was in line with market expectations and provided momentary hope for bullish investors
- Whipsawing price action ultimately turned to weakness as traders flocked to the dollar and stocks were routed
- Details in the Summary of Economic Projections (SEP) explain the move and give pointers to what might happen next
The US dollar’s immediate reaction to Wednesday’s US interest rate announcement was for the USD Basket Index to trade in a wide whipsawing 1% price range. Just before Jerome Powell confirmed US interest rates were rising by 75 basis points, the Index was trading at 110.71. Then in the following hour, it bottomed out at 110.30 and peaked at 111.34. The extreme immediate reaction was made more surprising by the fact that the 0.75% rate hike was what the market was expecting. Digging into the details of the Summary of Economic Projections (SEP) report, which was released at the same time, but took longer for analysts to read, helps explain the move.
USD Basket Index Price Chart – Hourly Candles – Reaction to Fed Rate Hike
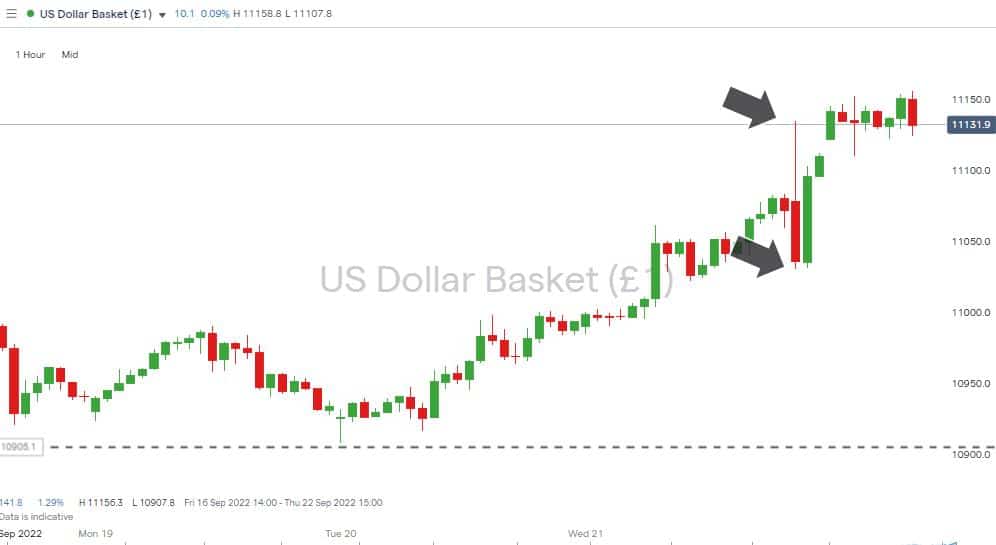
Source: IG
The guidance in the SES report is what steered the market into Wednesday’s close. Further dollar strength followed once analysts had had time to digest two key changes to medium-term forecasts. The first is that the Fed’s year-end target for the US interest rates was set higher than was forecast in June. At that time, the expected average range was 4.2%, and after yesterday’s FOMC meeting, it is now 4.4%.
The sizeable reduction in forecasts relating to US economic growth is possibly of greater importance. The 2022 GDP growth prediction, previously 1.7%, has been slashed to 0.2%. That doesn’t leave much margin of error before negative growth for the year is recorded. Despite the considerable scaling back in growth forecasts and the risk of a recession, Jerome Powell and his team also made it clear that inflation is their principal concern.
Also Read: EURUSD Forecast and Live Chart
USD Basket Index Price Chart – Daily Candles – Channel & RSI
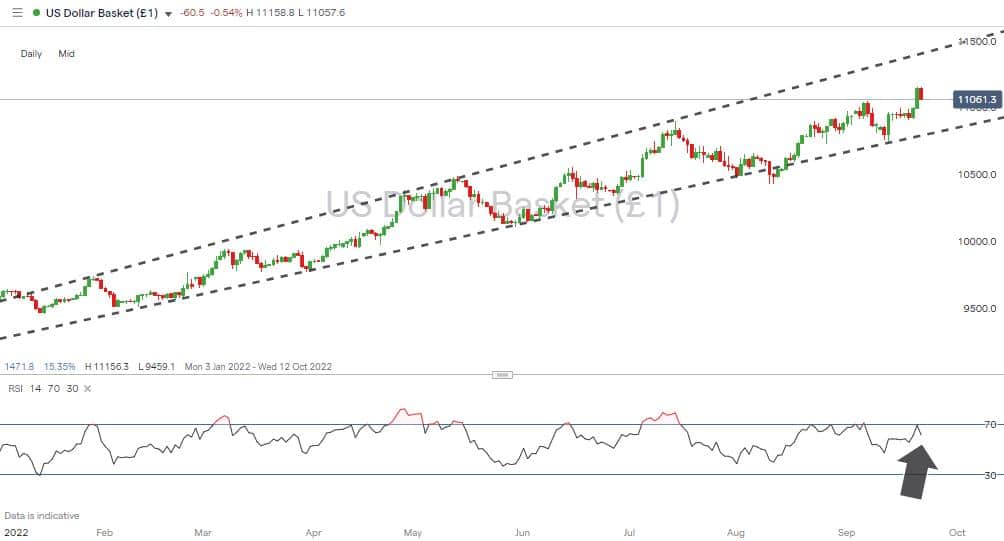
Source: IG
The ’more of the same’ message resulted in understandable dollar strength, but with the major news announcement of the month out of the way, it could now be up to technical indicators to guide forex prices.
In that respect, there is still room for forex markets to head either way in the next week. The Daily Price Chart for the US Dollar Index has price trading mid-range in its multi-month price channel. At the same time, the Daily RSI of 61.1 is closer to oversold, meaning further upside potential could be capped or delayed.
People Also Read
- Take Profits On GBPUSD Trades As BoE Prepares To Hike Interest Rates
- Forex Explained – What Are Major Forex Pairs?
- Forex Charts
If you have been the victim of a scam, suspect fraudulent behaviour, or want to know more about this topic, please contact us at [email protected]
 Your capital is at risk
  Your capital is at risk