The past week has offered a slight respite to bullish investors. Uncertainty about the long-term prognosis for the economy remains, but there have been upward price moves in markets such as the S&P 500 index and GBPUSD.
Key technical resistance levels are coming into play just as the market heads into a shortened trading week. At the same time, the next Federal Reserve interest rate meeting on 14th June will start to loom over the markets. The relief rally was understandable, but the situation could be about to change.
GBPUSD – Cable Moving Towards Resistance
The potential for a retracement rally in cable was identified on 16th May in the Technical Analysis and Trading Ideas report. At that point, the price had overextended to the downside and diverged so far from the 20 SMA on the Daily Price Chart that some kind of bounce could be expected. The rally’s strength has been surprising but possibly reflects profits being taken by short-sellers rather than a shift in the economic fundamentals of sterling and the dollar.
GBPUSD – Daily Price Chart – 2021 – 2022 – Resistance Levels Approaching
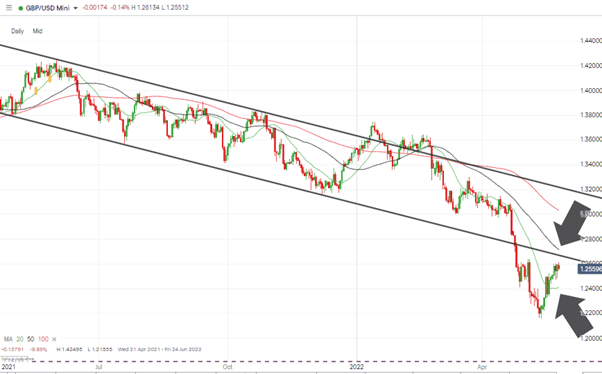
Source: IG
Cable’s rally from 1.2159 to above 1.260 has taken place over 14 trading sessions and hasn’t faced much opposition along the way. It is beginning to look like a classic bull trap with prices nearing two major resistance levels.
The first is the trend line which dates back to 30th April 2021, which was confirmed on 20th July, and 9th December 2021. That makes the region of 1.264 a critical test for the current rally and comes just as the RSI is trading above 50 on the Daily Price Chart, meaning GBPUSD is not ‘oversold’ for the first time since 22nd March 2022.
The 50 SMA on the Daily Price Chart sits just above that price level. Currently, at 1.2717, that metric is one that market price hasn’t traded above since 24th February 2022.
GBPUSD – Daily Price Chart – 2021 – 2022 – With RSI
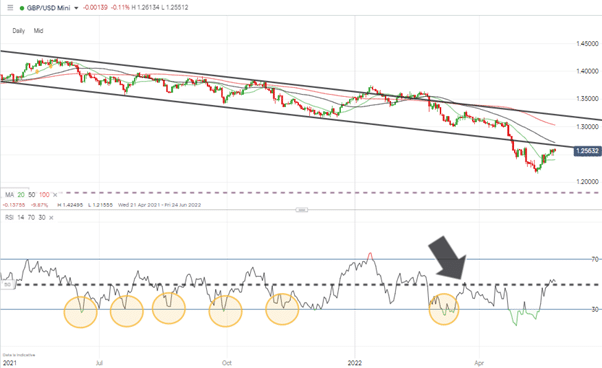
Source: IG
Wall Street – Dow Jones Industrial Average Index
It’s a similar story for most of the major stock indices. The Nasdaq is the exception as growth stocks continue to remain the most out of favour risk asset in the market, but the DJIA has recently rallied in a pattern much the same as that of GBPUSD.
DJIA Index – Daily Price Chart – 2021 – 2022 Relief Rally
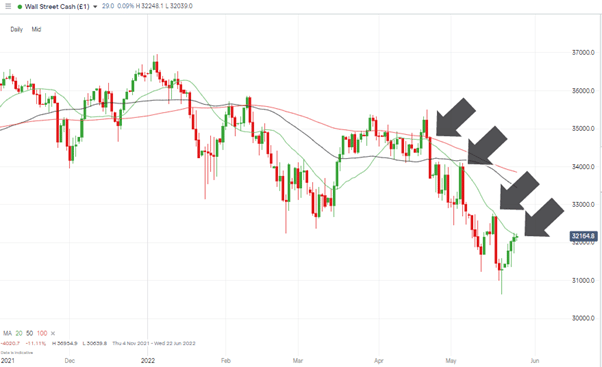
Source: IG
The 20 SMA on the Daily Price Chart has, since 22nd April 2022, been a reliable guide to the sell-off. Have the prospects for the global economy changed enough for this to be the time price breaks out to the upside? Probably not.
The wildcard is that financial markets will be running at half speed next week. The US Memorial Day holiday is on Monday 30th, and London markets will be closed on Thursday and Friday to commemorate the Queen’s jubilee. The bulls would probably take a week of price drifting sideways and consolidating at current levels as that would help the SMAs drift below live market prices rather than require a burst of buying activity for the price to push through. Things are set up for the next week to be interesting, even if quiet.
If you have been the victim of a scam, suspect fraudulent behaviour, or want to know more about this topic, please contact us at [email protected]
 Your capital is at risk
  Your capital is at risk