Instrument | Price | Hourly | Daily |
EUR/USD | 1.0416 | Strong Buy | Strong Sell |
GBP/USD | 1.2231 | Strong Sell | Strong Sell |
USD/JPY | 129.39 | Strong Buy | Buy |
S&P 500 | 4,007 | Neutral | Strong Sell |
NASDAQ 100 | 12,296 | Strong Buy | Strong Sell |
FTSE100 | 7,418 | Strong Buy | Strong Sell |
Gold | 1,798 | Strong Sell | Strong Sell |
Crude Oil WTI | 107.79 | Neutral | Strong Buy |
Bitcoin | 29,672 | Strong Sell | Strong Sell |
Ethereum | 2,016 | Strong Sell | Sell |
UTC 08:05
Our trading signal analysis is based on a comprehensive summary of market data. We use a range of metrics with weighting given to simple and exponential moving averages and key technical indicators.
We created this Weekly Tips section to share possible trade entry and exit points based on our technical analysis. We also have other methods to validate our trades which we can’t publicly share that help to increase their success. All our trades include entry and at least one target price. Stop losses are applied at the reader’s discretion. Our strategies typically trade with a wide stop loss, and risk is further mitigated by trading in small sizes.
The FTSE 100 equity index, the euro-dollar currency pair, and crypto market indicators all point towards short-term strength and long-term weakness. Trading decisions need to be made with holding periods in mind, and choppy market conditions could prevail in the run-up to the Fed’s big announcement.
FOCUS ON: A Busy News Week In The UK Puts the Focus on GBPUSD and FTSE 100
Friday the 13th was indeed an unlucky date for the markets. Every major US stock index posted a down week, making that a run of six red weekly candles. GBPUSD, EURUSD and gold all lost ground over the five trading days. Cryptos took the biggest hit, with BTC down 11.48% and Ethereum losing a massive 17.71% in value.
Even the price of crude oil softened over the last week, but that still trades well over $100 per barrel, leaving the FTSE 100 index the only market on our Technical Matrix posting a positive return. That +0.56% rise is, however, less linked to optimism in the underlying stocks and more to do with the pound’s weakness. That means the big exporting firms in the index will see their overseas profits inflated due to currency moves.
The UK stock market and currency look likely to take centre stage again this week due to a heap of economic data coming down the pipeline.
Tuesday 17th May:
- UK Unemployment Rate
Wednesday 18th May:
- UK Consumer Price Index
- UK Retail Price Index
- UK Producer Price Index
Friday 19th May:
- UK GfK Consumer Confidence
- UK Retail Sales
The pound’s peak to trough fall during 2022 stands at +11%, pointing to the medium and long-term path of least resistance continuing downward. With so many data reports due to be released, there is a chance of a relief rally should any of the statistics not tally with the pessimistic expectations, which look to be already priced in.
GBPUSD Price Chart – 1Day Candles – 11% fall in value 2022
Source: IG
Indices
NASDAQ 100
First-hand confirmation that tech stocks might still be overvalued was provided by Elon Musk last week. After previously offering to buy Twitter Inc for $54.20 per share and promising to “unlock the potential” of the social media platform, he was threatening to walk away from the deal by the end of last week. Without the support of his buyout offer, Twitter stock finished the week trading a few cents above the $40 price level.
The loss recorded over the trading week was 2.37%, but that hides the intra-week low of 11,688 recorded on Thursday being some way off Friday’s closing price of 12,359.
NASDAQ 100 Chart – 1Day Candles – Watch 12,211
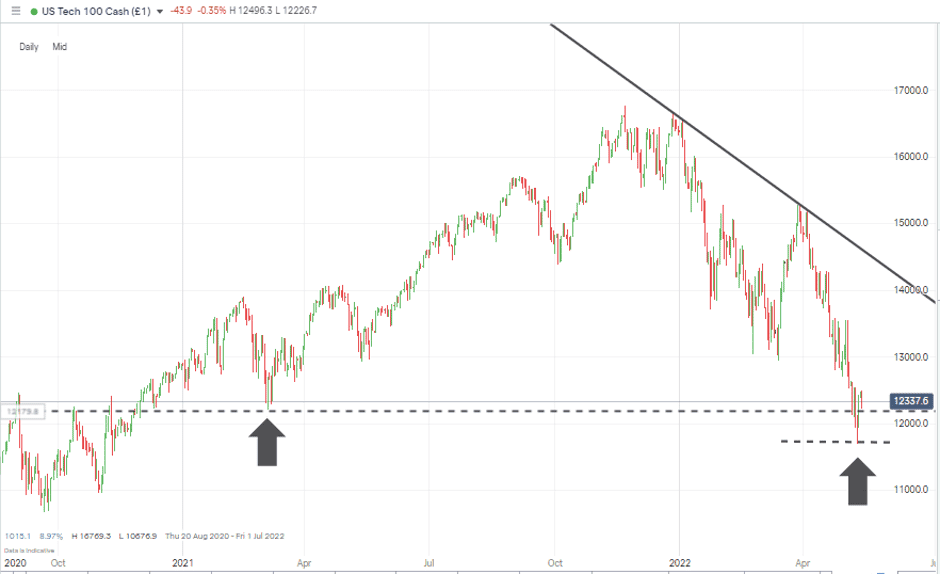
Source: IG
Friday’s rally coincided with the RSI on the Daily Price Chart clipping 30. Anyone who had the patience to wait for that key metric to be triggered will now be in a profitable trade, but further upward price movement requires the critical support level at 12,211 holding. That price level marks the low of Friday 5th March 2021.
NASDAQ 100 Chart – 1Day Candles – RSI touched 30
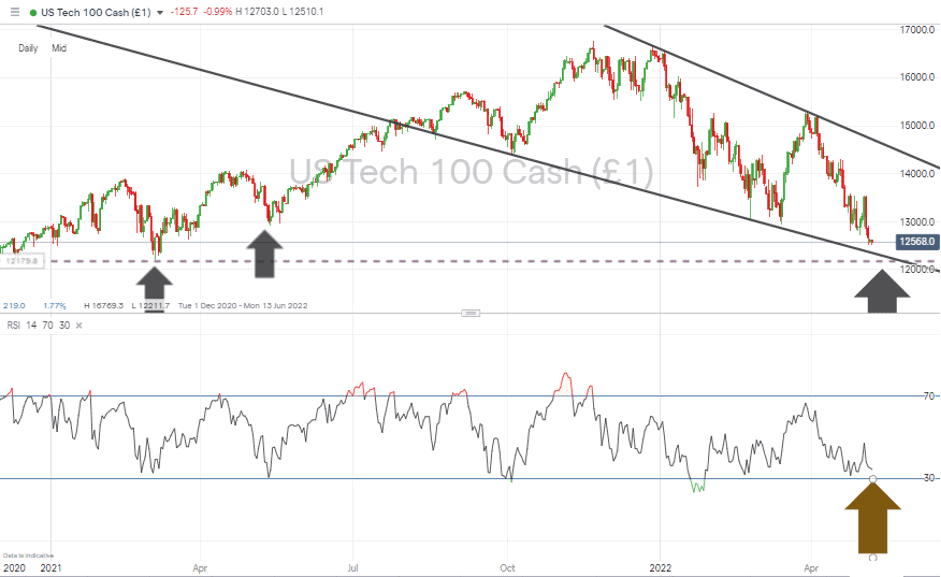
Source: IG
Long positions
- Entry Level 1: 12,211 – Supporting trend line formed by the swing-low pattern of March 2021.
- Price Target 1: 12,944 – Year-to-date price low recorded in March
- Price Target 2: 13,775 – Region of the 50 SMA on the Daily Price Chart
- Stop Loss: < 12,000 – Psychologically significant ’round number’ supporting price level and just below the 12,211-support level, which can be expected to have a lot of stop losses set close to it.
Short positions
- Entry Level 1: 12,211 – Price low of March 2021. Applying a breakout/momentum-based strategy.
- Price Target 1: 11,688 – Price low of Thursday 12th May 2022.
- Stop Loss: > 12,775 – Region of the 20 SMA on the Daily Price Chart
FTSE 100
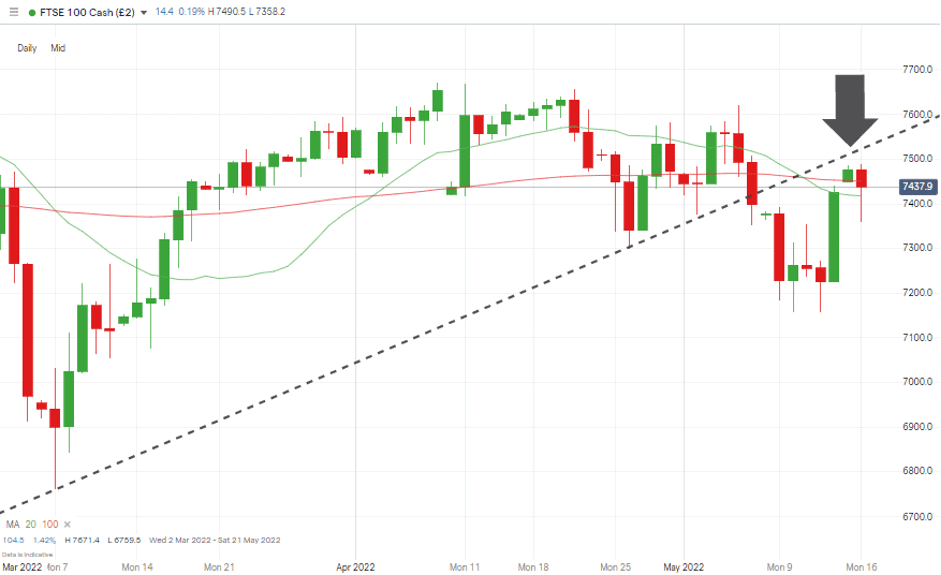
The FTSE gained a few basis points last week despite members of its peer group, such as the S&P 500 and DJIA, both losing ground. That can be attributed to the weakness in GBPUSD, which means the multinationals generate a lot of their profits in non-GBP currencies and so will see their GBP profits inflated by the pound’s weakness.
The trendline that dates back to 7th March 2022 has come into play. The support that line offered until Friday 6th May 2022 can now be expected to act as resistance.
FTSE 100 Daily Price Chart – Trendline Coming Back Into Play
 Source: IG
Long positions
- Entry Level 1: 7,416 – Region of the 20 SMA on the Daily Price Chart.
- Entry Level 2: 7,514 – Region of the multi-week trend line. Applying a momentum strategy and expecting a break back above that line to mark further upward movement.
- Price Target 1: 7,671 – Price high of Friday 5th April 2022.
- Stop Loss: < 7,156 – Price low printed on Tuesday 10th May 2022
Short positions
- Entry Level 1: 7,514 – Interpreting the multi-week trend line as a resistance level and selling into short-term strength.
- Price Target 2: 7,000 – Round number support level and region of the 100 SMA on the Monthly Price Chart
- Stop Loss: > 7,671 – Price high of Friday 5th April 2022.
Oil
After breaking out of the descending wedge pattern on 3rd May, price has gone back to following the 20 SMA on the Daily Price Chart. There is some consolidation shown by the 20, 50 and 100 SMA’s, but buying into the dips opens the door to benefit from any news-driven price spike.
Last week’s Trading Ideas Report successfully identified the opportunity to buy into a pullback to 104.26. Continuing that strategy appears to be the best way of trading oil as it trades in a wide-ranging but sideways price pattern.
US Crude Oil – Daily Price Chart – Tracking the 20 SMA
![]()
Source: IG
Long positions
- Entry Level 1: 104.34 – Buying the dip during any pullback, which takes price to the region of the 20 SMA on the Daily Price Chart.
- Price Target 1: 128.20 – Price high of 6th March 2022, which also represents the year to date high for crude.
- Stop Loss: < 100.34 – Region of the upper trend line of the wedge pattern, which previously acted as resistance but now provides support.
Forex
GBPUSD
Weakness in GBPUSD has been a recurring theme of recent Trading Ideas Reports. That trend shows no sign of turning.
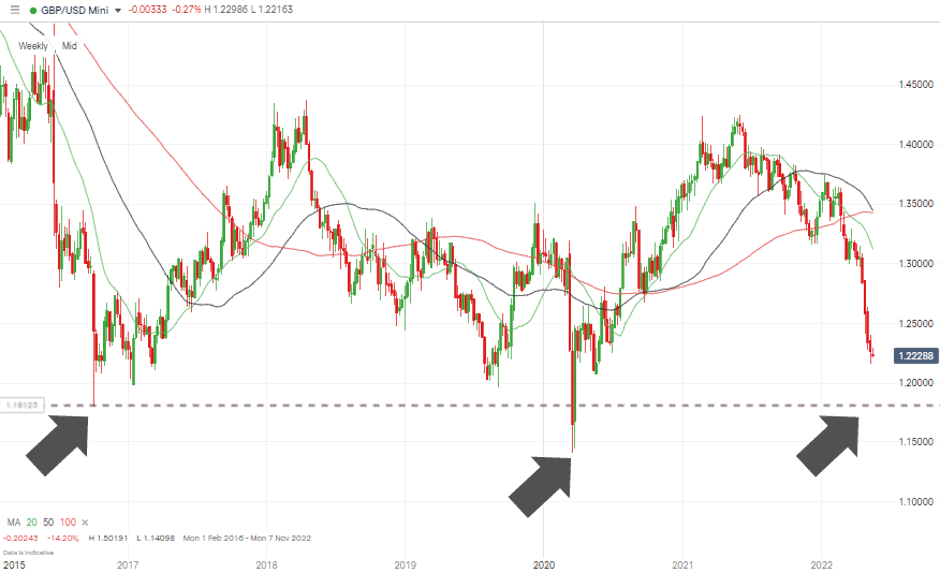
Price is currently an extended distance from the 20 SMA on the Weekly price chart, 1.2230 compared to 1.3120. With so much UK orientated economic data due out this week, there is potential for a short-term reversal and a relief rally, but how short-lived remains the key question.
Tuesday 17th, Wednesday 18th and Friday 20th May are the days to watch out for with inflation data, unemployment figures, and consumer confidence numbers due out on those days, respectively.
GBPUSD – Weekly Price Chart – Bearish price action & possible test of 2017 price levels
Source: IG
Short positions
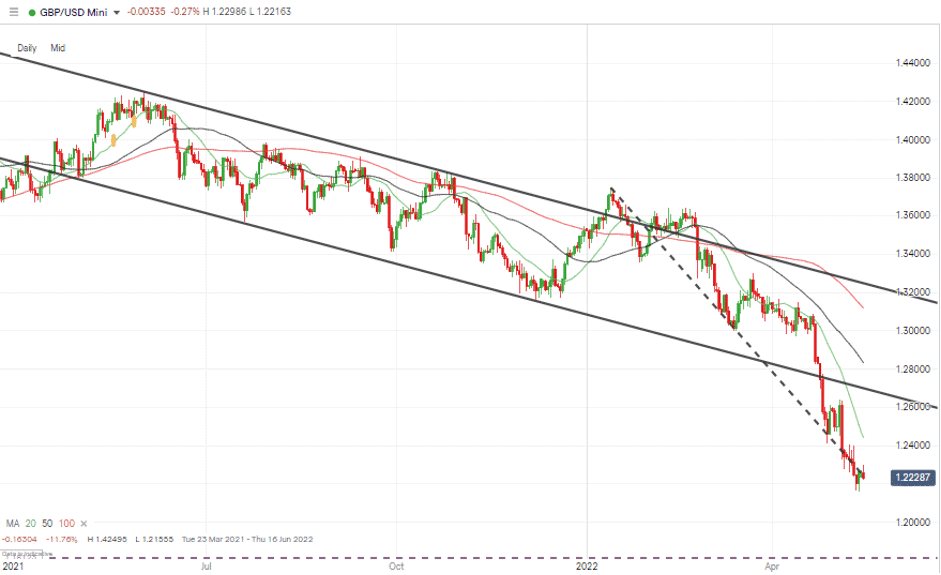
- Entry Level 1: 1.2439 – Region of the 20 SMA on the Daily Price Chart.
- Price Target 1: 1.1800 – Price low of October 2016, printed during the height of the Brexit crisis.
- Stop Losses: > 1.270 – Round number resistance and lower trend line of the price channel dating back to April 2021.
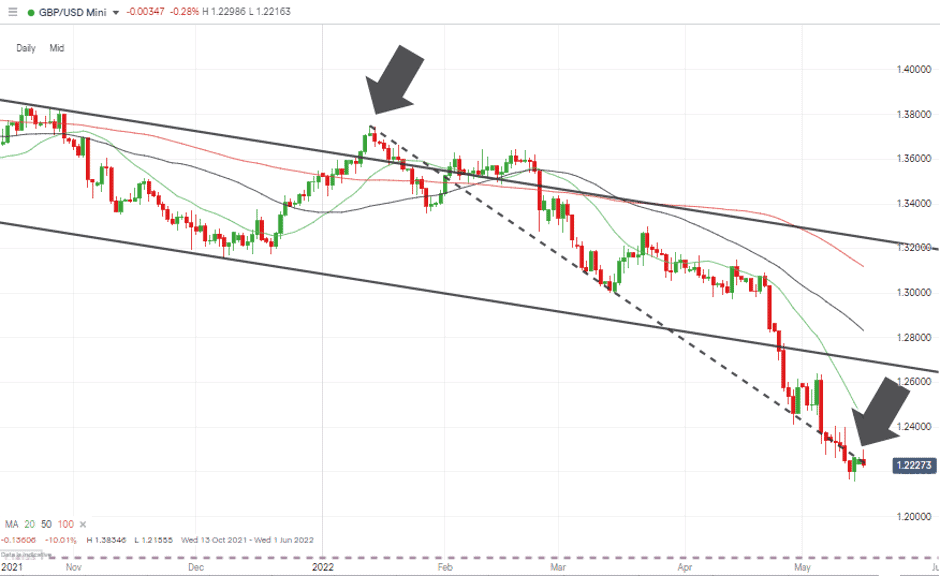
GBPUSD – Daily Price Chart – Bearish price action & trendline break
Source: IG
Long positions
- Entry Level 1: 1.2073 – Price low recorded during the week of 18th May 2020. Just above the psychologically important price level of 1.2000.
- Price Target 1: 1.2439 – Region of the 20 SMA on the Daily Price Chart.
- Stop Losses: < 1.1800 – Price low of October 2016, printed during the height of the Brexit crisis.
Crypto – Bitcoin & Ethereum
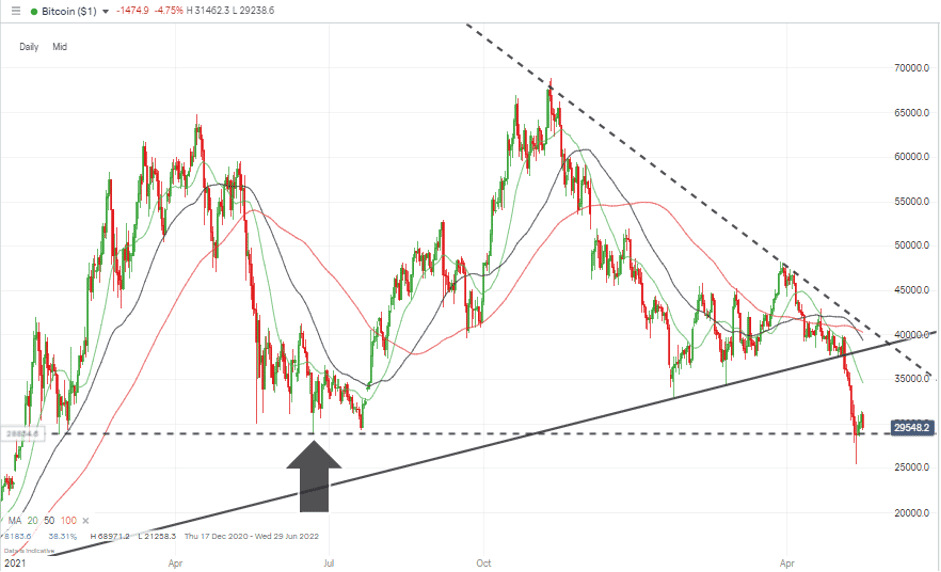
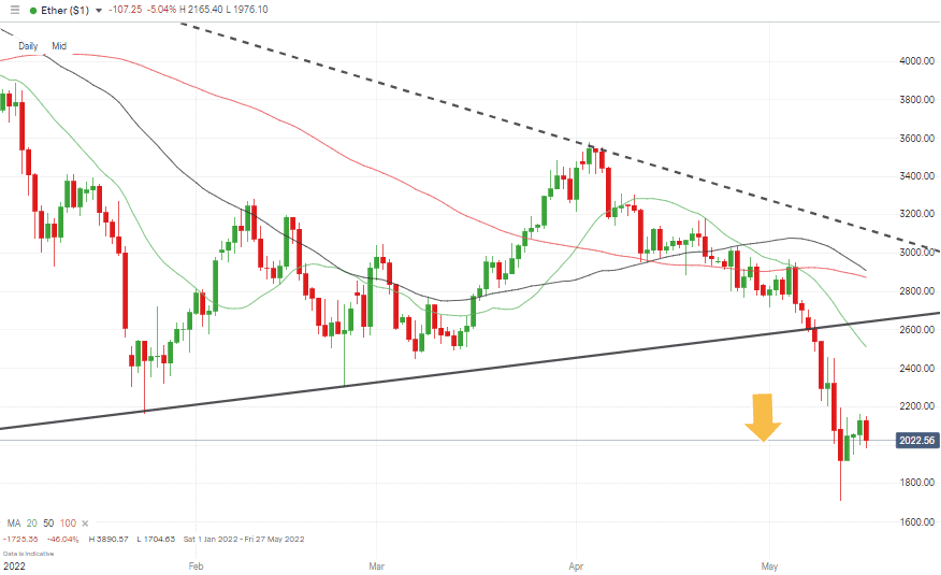
Bitcoin and Ether experienced major sell-offs last week after the collapse of stablecoin TerraUSD. Ether traded below the psychologically important price level of $2,000 on Thursday 12th May and printed prices as low as 1,704. It has since risen above the 2k price bar but doesn’t yet appear to have significant upward momentum. On the same day, Bitcoin traded below $26,000, which marked a 16-month price low.
Bitcoin – Daily Price Chart – 16 Month Lows
Source: IG
Bitcoin Long positions
- Entry Level 1: 28,714 – Price low of 22nd June 2021.
- Price Target 1: 34,593 – Region of 20 SMA on Daily Price Chart.
- Price Target 2: 39,371 – 40,278 – Region of the 100 and 50 SMAs on the Daily Price Chart.
- Stop Losses: < 25,385 – Below price low of Friday 13th May 2022.
Ethereum – Daily price chart – Key $2,000 Price Level
Source: IG
Ethereum Long positions
- Entry Level 1: 2,000 – Round number support, which has come into play over the last week.
- Price Target 1: 2,510 – Region of the 20 SMA on the Daily Price Chart
- Price Target 2: 2,640 – Region of the lower trend line of the wedge pattern.
- Stop Losses: < 1,704 – Year-to-date low of Thursday 12th May 2022.
Risk Statement: Trading financial products carries a high risk to your capital, especially trading leveraged products such as CFDs. They may not be suitable for everyone. Please make sure that you fully understand the risks. You should consider whether you can afford to risk losing your money.

Forextraders' Broker of the Month
BlackBull Markets is a reliable and well-respected trading platform that provides its customers with high-quality access to a wide range of asset groups. The broker is headquartered in New Zealand which explains why it has flown under the radar for a few years but it is a great broker that is now building a global following. The BlackBull Markets site is intuitive and easy to use, making it an ideal choice for beginners.