- A technical indicator which has signalled the end of every stock bear market since 1960 has just been triggered.
- The February month-end price of the S&P 500 index closed above 3947, the level of the 10-month moving average.
- The 2022 bear market in stocks could be over, with wide-ranging repercussions for all asset groups.
Traders of all asset groups might want to note that a sometimes overlooked but historically reliable technical indicator has signalled the 2022 bear market in stocks could have bottomed out. A resurgence in stock prices would have a far-reaching impact across the financial markets, leading to many considering just how strong an indicator the 10 Month Simple Moving Average on the Monthly Price Chart is.
S&P 500 Index – Monthly Price Chart 2022 – 2023 – With 10-Month SMA
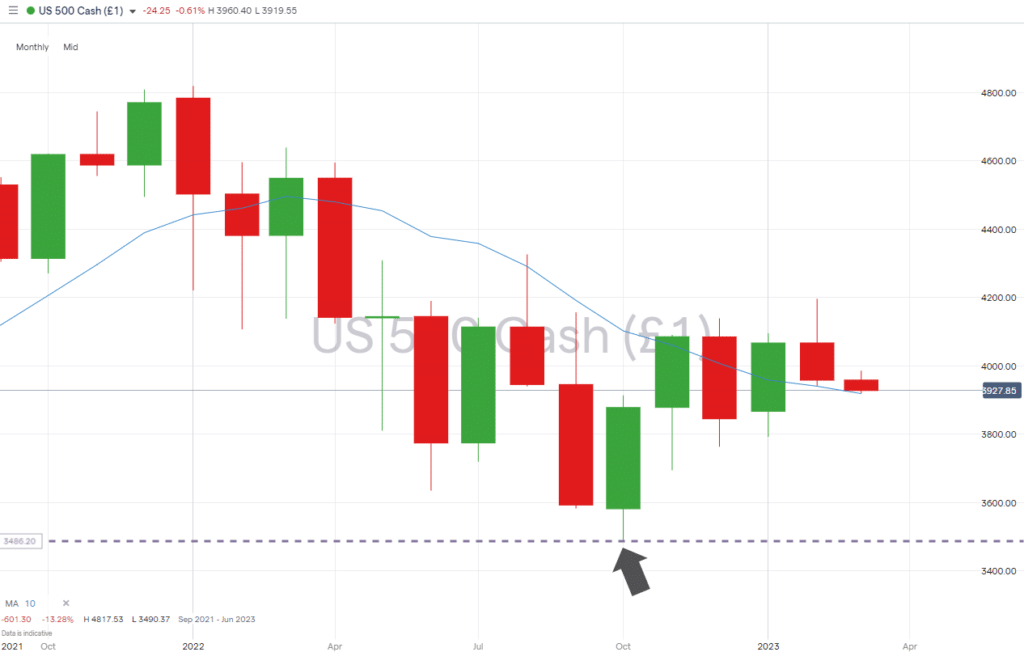
Source: IG
Also Read: Disconnect Between Forex and Stock Markets Points Towards Increased Volatility
Is the S&P 500 Ready to Bounce?
Between January and October 2022, the S&P 500 index posted a 27.2% fall in value. With the standard definition of a bear market requiring a fall greater than 20%, technical analysts have naturally been looking for indicators which could point towards the market having bottomed out. It seems like they’ve found one.
The 10 Month SMA might not be every trader’s go-to indicator, but it does have an impressive track record of signalling moments when a stock bear market has ended. Historical data shows that every time since 1960, the bear market low of the S&P 500 index has been marked when the price of the index closes above the 10 Month SMA for two consecutive months.
Following the massive sell-off in stocks in 2022, the rally into year-end resulted in the index’s closing price being 4066 in January and 3958 in February of 2023. Both were above the 10 Month SMA at their respective month ends.
S&P 500 Index – Monthly Price Chart 2022 – 2023 – With 10-Month SMA
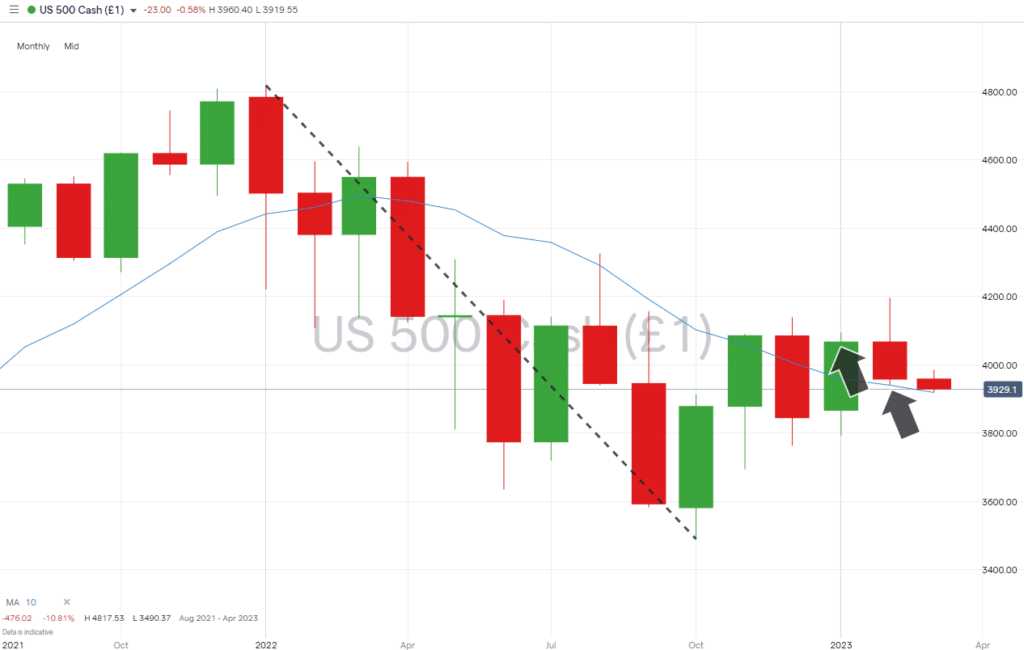
Source: IG
The 10 Month SMA signal will remain effective as long as price trades above the low point of the 2022 bear market, the 3490 price-low recorded in October 2022. If it breaks that level, then the signal has failed.
Those looking to bottom-fish the market will also note that price currently sits at 3928 and can fall by more than 10% before testing the make-or-break 3490 level. After a painful 2022, many investors might need some convincing that the worst is over. But those looking for a sign do now have one.
People Also Read:
- The Week Ahead – 27th February 2023
- WEEKLY FOREX TRADING TIPS – 2023.02.27
- EURUSD Approaches Key Support Level as Fed Minutes Match Market Expectations
If you have been the victim of a scam, suspect fraudulent behaviour, or want to know more about this topic, please contact us at [email protected]
 Your capital is at risk
  Your capital is at risk