
FOCUS ON: Range-Bound Price Action
- Markets respond to the likelihood of interest rates remaining higher for longer.
- Dollar finds strength on the back of comments made by the US Federal Reserve.
- Busy week in terms of Eurozone data releases makes it a big week for euro currency pairs.
Trading Ideas
We created this Weekly Tips section to share possible trade entry and exit points based on our technical analysis. We also have other methods to validate our trades which we can’t publicly share that help to increase their success. All our trades include entry and at least one target price. Stop losses are applied at the reader’s discretion. Our strategies typically trade with a wide stop loss, and risk is further mitigated by trading in small size.
Instrument | Price | Hourly | Daily |
GBP/USD | 1.1955 | Neutral | Strong Sell |
EUR/USD | 1.0555 | Neutral | Strong Sell |
USD/JPY | 136.21 | Neutral | Strong Buy |
S&P 500 | 3,985 | Strong Sell | Strong Sell |
NASDAQ 100 | 12,031 | Strong Sell | Strong Sell |
FTSE100 | 7,937 | Strong Buy | Strong Buy |
Gold | 1,810 | Strong Sell | Strong Sell |
Crude Oil WTI | 76.61 | Strong Buy | Strong Sell |
Bitcoin | 23,320 | Sell | Sell |
Ethereum | 1,631 | Buy | Strong Buy |
UTC: 09:56
US Dollar Basket Index (DXY)
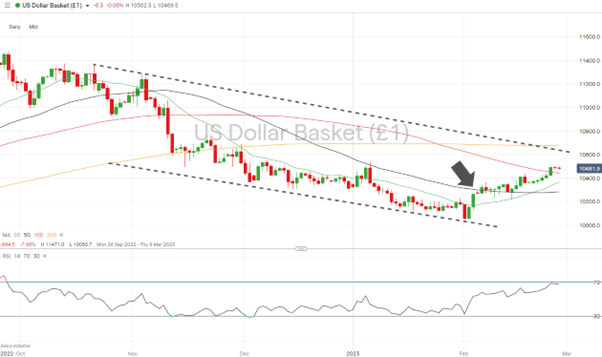
The absence of any interest rate announcements from major central banks hasn’t dampened their ability to influence the markets. Last week’s release of minutes of the last meeting of the US Fed pointed to the FOMC members sticking with their approach of talking a tough game.
With employment levels remaining stable and high there is a chance of the Fed managing to achieve a ‘soft landing’ for the US economy. It also means there is little reason to deviate from keeping interest rates high until the task of defeating inflation is completed.
US Dollar Basket Chart – Daily Price Chart – Above 50 SMA
Source: IG
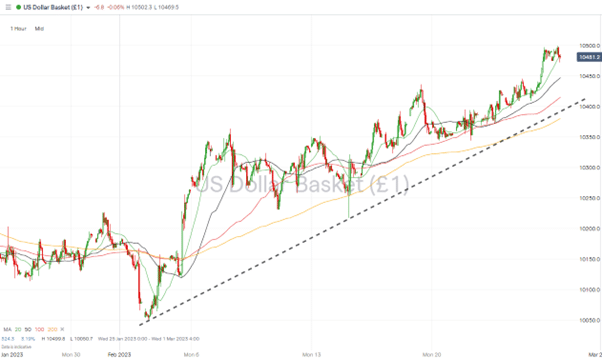
US Dollar Basket Chart – Hourly Price Chart
Source: IG
Short positions
- Entry Level 1: 104.97 – With the RSI on the daily price chart being close to 70 there is a chance that the US Dollar Basket index could be ‘overbought’ on that time frame. The month-to-date price high of Friday 24th February providing an entry point for those looking to take short positions.
- Price Target 1: 104.47 – Region of the 50 SMA on the Hourly Price Chart. Has provided price support since 21st February.
- Price Target 2: 102.17 – Price low of 14th February. Also, the region of the 20 SMA on the Daily Price Chart.
- Price Target 3: 100.00 – In extension, parity price level.
- Stop Loss: > 105.37 – Year-to-date price high printed on 6th January 2023.
Long positions
- Entry Level 1: 104.47 – Region of a convergence between the 50 SMA on the Hourly Price Chart and the 100 SMA on the Daily Price Chart (currently 104.39)
- Price Target 1: 104.97 – Month-to-date price high of Friday 24th February
- Price Target 2: 105.37 – In extension, year-to-date price high recorded on 6th January 2023.
- Stop Loss: < 102.00 – Round number price support/resistance level which provided a base level for price action between 12th January and 3rd February 2023.
GBPUSD
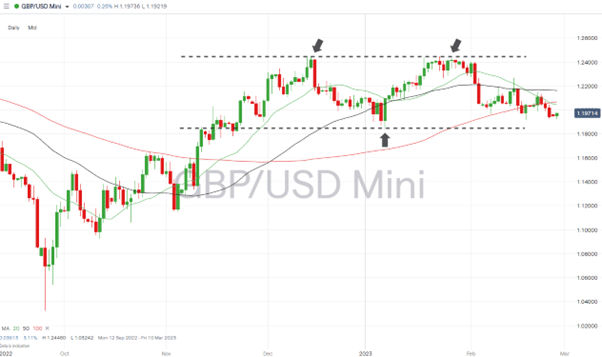
Price support in the region of 1.18413, the low recorded on 6th January 2023, continues to keep GBPUSD in a sideways trading channel. The high water mark of that channel is 1.24470 which was recorded on 14th December 2022 and although further consolidation appears to be the most likely outcome for the next week there remains a chance of a bearish double-top price pattern being formed.
The RSI on the Daily Price Chart has traded between 40 and 45 for the last two weeks and continues to leave room for price to move in either direction before becoming ‘overbought’ or ‘oversold’ on that timeframe. That introduces the prospect of trade entry points arising for those applying range-trading strategies.
Daily Price Chart – GBPUSD Chart – Daily Price Chart
Source: IG
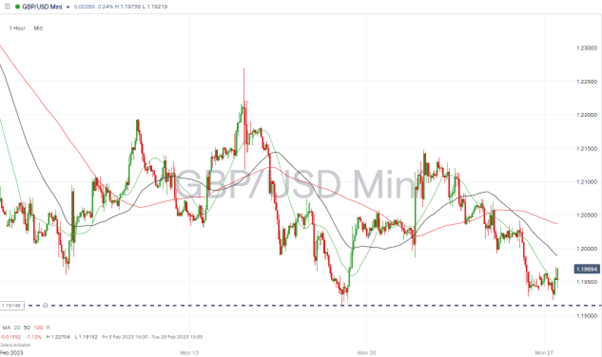
GBPUSD Chart – Hourly Price Chart
Source: IG
Short positions
- Entry Level 1: 1.18413 – Price low of 6th January and pivot point of the potential double-top price pattern. Also, the region of the 200 SMA on the Daily Price Chart (1.1848).
- Price Target 1: 1.11704 – Closing price of 3rd November 2022.
- Stop Loss: > 1.20453 – Region of the 20 SMA on the Daily Price Chart. Currently sitting just above the psychologically important 1.20 price level.
Long positions
- Entry Level 1: 1.18413 – Year-to-date price low of 6th January. Pivot point of the potential double-top price pattern. And the region of the 200 SMA on the Daily Price Chart (1.1848).
- Price Target 1: 1.21614 – Region of the 50 SMA on the Daily Price Chart. Acted as price support and resistance on 3rd and 15th February 2023.
- Price Target 2: 1.22156 – The 61.8% Fibonacci retracement price level formed by the price fall between 14th December 2022 and 6th January 2023.
- Price Target 3: 1.24480 –Year-to-date price high printed on 23rd January.
- Stop Loss: < 1.18413 – Tight stop-loss as few support levels can be found below trade entry point.
EURUSD
Euro-based currency pairs are set for a busy week with another collection of economic reports coming out of the Eurozone economies.
Unlike GBPUSD, the RSI on the EURSD Daily Price Chart has moved to as low as 30.8 during the last week. Suggesting a bounce could be imminent.
EURUSD Chart – Daily Price Chart –SMA Break
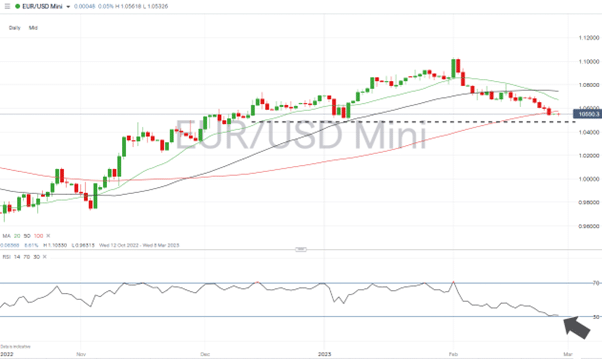
Source: IG
EURUSD Chart – Hourly Price Chart
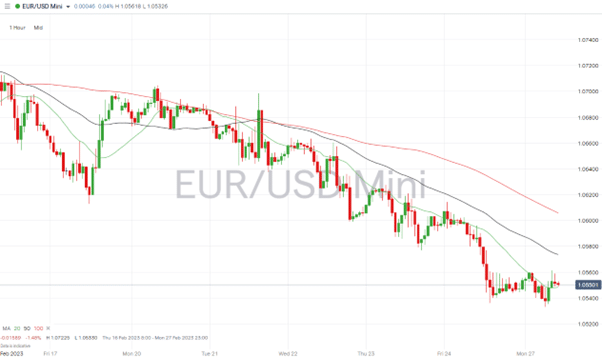
Source: IG
Short positions
- Entry Level 1: 1.05773 – Selling into strength which takes price within the range of the 100 SMA on the Daily Price Chart.
- Price Target 1: 1.04822 – Year-to-date price low of 6th January 2023.
- Stop Loss: > 1.06114 – 38.2% Fib retracement level of the EURUSD price fall between January 2021 and September 2022.
Long positions
- Entry Level 1: 1.04822 – Price low of 6th January 2023.
- Price Target 1: 1.05773 – Region of the 100 SMA on the Daily Price Chart.
- Price Target 2: 1.06128 – Price low of 17th February. Sits just above the 38.2% Fib retracement support/resistance price level.
- Stop Loss: <1.02903 – Swing-low price point, recorded on 30th November 2022.
Indices
S&P 500
Hawkish comments from central banks hit equities hard last week. From a technical analysis perspective, the price of major indices are resting on key SMA support levels, and with the RSI of the S&P 500 reading 41 there appears to be a chance of a short-term bounce.
S&P 500 Chart – Daily Price Chart –SMA Support
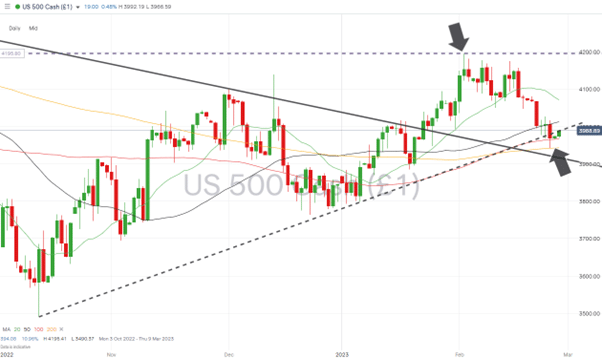
Source: IG
S&P 500 – Hourly Price Chart
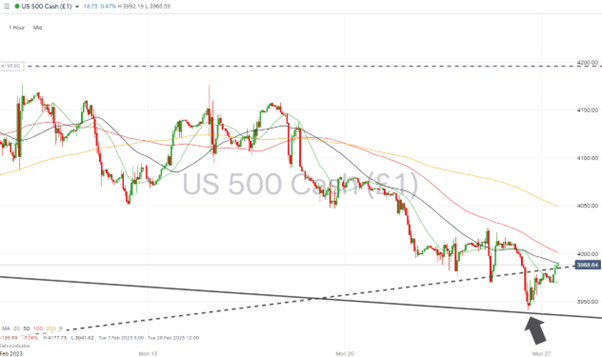
Source: IG
Short positions
- Entry Level 1: 3,941 – Applying a momentum-based strategy and selling into price weakness which causes a break of the 200 SMA on the Daily Price Chart. That price level also marks the region of the low recorded on 24th February.
- Price Target 1: 3,900 – Region of upper trend line of the downwards price channel dating from Jan 2022.
- Stop Loss: > 3,966 – 50 SMA on the Daily Price Chart.
Long positions
- Entry Level 1: 3,941 – With the 200 SMA on the Daily Price Chart being such a key indicator that metric can also be used by those looking to buy the dip.
- Price Target 1: 3,990 – Resistance can be expected in the region of the supporting trendline dating from 13th October 2022.
- Price Target 2: 4,071 – Region of the 20 SMA on the Daily Price Chart.
- Stop Loss: < 3,900 – Region of upper trend line of the downwards price channel dating from Jan 2022. Can now be expected to offer price support.
Crypto – Bitcoin & Ethereum
Both of the major crypto coins are maintaining their bullish price patterns but some divergence in the price of Bitcoin and Ether opens up the door to increased price volatility coming into the market. On a week-on-week basis BTC posted a 4.35% price fall, which ETH increased in value by 8.59%.
Bitcoin Price Chart – Daily Price Chart
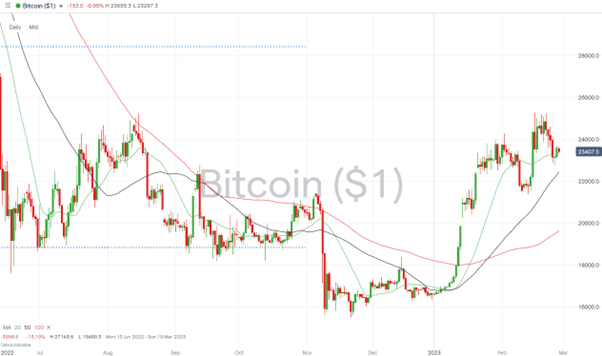
Source: IG
Bitcoin Long positions
- Entry Level 1: 22,425 – Buying into weakness which takes price into the region of the 50 SMA on the Daily Price Chart.
- Price Target 1: 25,250 – Year-to-date price high of 16th February. Has since then provided resistance on three separate occasions.
- Price Target 2: 28,409 – 61.8% Fib retracement level of the upwards price move in BTC recorded between February 2019 and November 2021.
- Stop Losses: < 20,000 – ‘Round number’ support level.
Ethereum
Ethereum Chart – Daily Price Chart
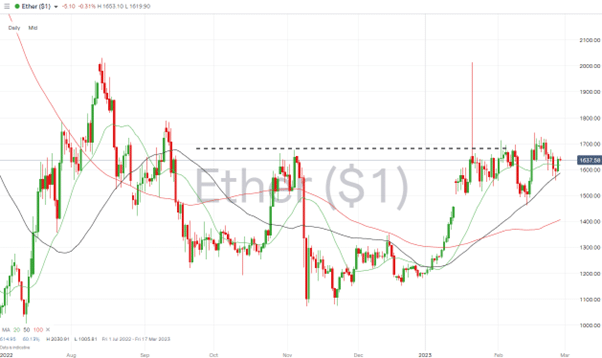
Source: IG
Ethereum Long positions
- Entry Level 1: 1,742 – Buying into upwards momentum which takes price through the high of 16th February.
- Price Target 1: 2,000 – Psychologically important ‘round number’ resistance price level. Also, the region of the price high of 13th August 2022.
- Stop Losses: < 1,616 – Region of the 20 SMA on the Daily Price Chart.
Risk Statement: Trading financial products carries a high risk to your capital, especially trading leverage products such as CFDs. They may not be suitable for everyone. Please make sure that you fully understand the risks. You should consider whether you can afford to take the risk of losing your money.

Forextraders' Broker of the Month
BlackBull Markets is a reliable and well-respected trading platform that provides its customers with high-quality access to a wide range of asset groups. The broker is headquartered in New Zealand which explains why it has flown under the radar for a few years but it is a great broker that is now building a global following. The BlackBull Markets site is intuitive and easy to use, making it an ideal choice for beginners.