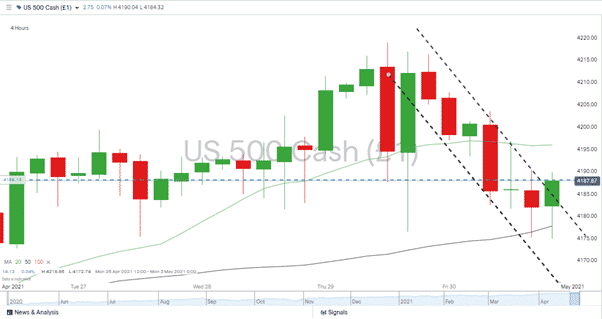
The historical price moves, which coined the adage “Sell in May, then go away,” might have triggered an early rush to the door as US indices tanked during the last trading session in April. Friday’s sell-off in the US ran up to the closing bell, DJIA down 0.55%, S&P 500 down 0.72%, and Nasdaq Composite down 0.82% on the day.

Source: IG
The poor run-in to the end of the week took the edge off an otherwise stellar April performance, with the S&P 500 still posting a +5.19% monthly return. It also raises the question of whether markets are beginning to look tired. The last week of the month was packed full of cornerstone data releases that were by and large positive. Apple’s earnings beat was staggering, and the US Fed confirmed on Wednesday that cheap money would continue flooding the markets for quite some time, but equity markets failed to push on to higher levels.
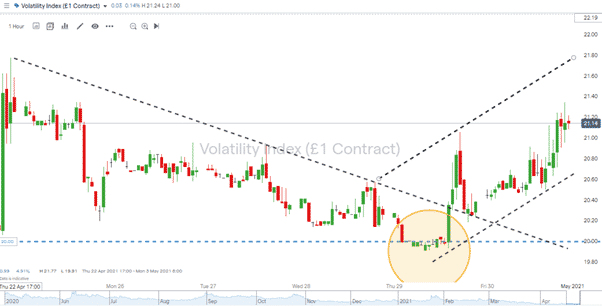
At the same time, the Volatility Index (VIX) bounced from its test of the 20.00 price level, which Forex Traders analysts picked as a key indicator in their report of last Thursday. That index has since headed north and is printing above 21.00, suggesting Friday’s off-loading comes from some big players in the market taking profits off the table. As the VIX index is derived from the derivative markets, it also suggests they have been taking out insurance against a correction by buying put options.

Source: IG
Does “Sell in May” Work?
The basic premise that markets perform poorly in the summer months is based on historical price data. The quiet summer markets are periods when big decision-makers are on the beach, so prices drift. Then in the autumn, activity picks up again as the finance industry gets back to business.
| S&P 500 “Sell in May” Returns (May-October) | |
| Year | S&P 500 “Sell in May” Return |
| 2010 | -0.3% |
| 2011 | -8.1% |
| 2012 | +1.0% |
| 2013 | +10.0% |
| 2014 | +7.1% |
| 2015 | -0.3% |
| 2016 | +2.9% |
| 2017 | +8.0% |
| 2018 | +2.4% |
| 2019 | +3.1% |
Source: LPL Research
From 1950 to 2013, the Dow Jones Industrial Average (DJIA) has posted an average return of only 0.3% during the May – October period. This compares poorly with an average gain of 7.5% during the November – April period. In recent years the adage has come unstuck. The record bull run in the 2010s broke nearly every rule in the book, and anyone who sold in May would have often missed out on solid summer returns.
Is 2021 a Year to Follow “Sell in May”?
Considering the unprecedented events of the last 14 months, there is a lot of ‘noise’ that could be expected to reduce the effect of a low-level seasonal trend that sometimes does and sometimes doesn’t come into play. Such statistical moves tend to hold more weight when other price drivers come into play, like a global pandemic that shuts up the global economy, for instance.
The incredible multi-month bull run, which started in March of 2020, blew the sell in May theory out of the water that year. Summer holiday plans might, or might not, cause a sell-off this year, but recent moves in the VIX are also suggesting some kind of correction is increasingly likely.
If you want to know more about this topic, please contact us at [email protected]
 Between 74-89% of CFD traders lose
  Your capital is at risk
  Your capital is at risk
  Your capital is at risk