Gold may not have the track record of being able to double in value in the same time frame as a tech stock or a cryptocurrency; however, gold price move trends can be long-running, and one appears to have just started. A series of technical and fundamental analysis indicators have just triggered buy signals. While nothing can ever be guaranteed, the alignment of trade entry signals has brought the metal to the attention of many.
Gold Technicals
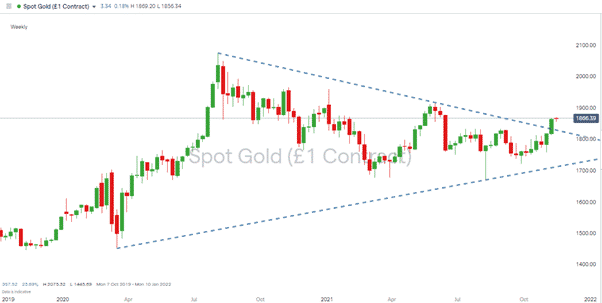
Gold’s break out of the descending wedge pattern, which dates back to August 2020, is in technical terms a big deal. Price had been passively funnelling towards the end of the wedge but last week broke through the upper resistance line with some momentum. The weekly price rise from 8th November was the strongest since May.
Spot Gold – Weekly Price Chart 2019 – 2021
 Source: IG
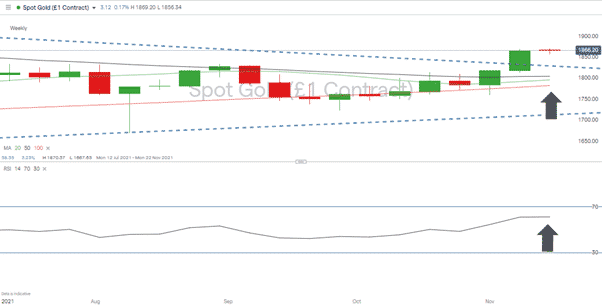
The Weekly price chart has an RSI of 62, still some way below the overbought level of 70. The SMA’s (Simple Moving Averages) have not yet caught up with the move with the 50 above the 20, though better news for gold bugs is that both of these are running at a higher price level than the 100 SMA.
Spot Gold – Weekly Price Chart 2021 – RSI & SMA

Source: IG
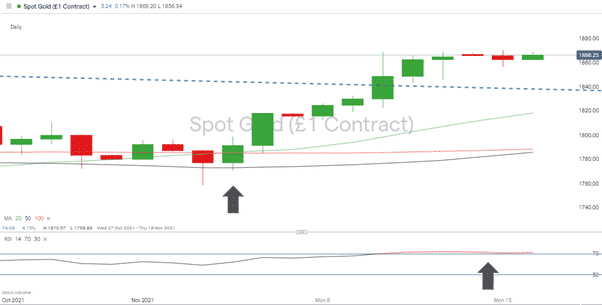
The daily price chart SMA’s are aligned in a more bullish format, and the recent +5% price rise, which started on 4th November, was marked by a classic upwards intersection of the 50 SMA by the 20 SMA. On the daily timeframe, it’s the RSI, which is offering a cautionary signal. That has been trading above 70 since 10th November, suggesting a short-term pullback can’t be dismissed.
Spot Gold – Daily Price Chart 2021 – RSI & SMA

Source: IG
Gold Fundamentals
While technical indicators are leaning towards the path of least resistance upwards, reasons for the upward momentum continuing can also be traced back to fundamental price drivers.
It’s estimated that jewellery accounts for 50% of the world’s gold demand, and seasonal demand spikes are now coming into play. The Indian wedding and festival season, Chinese New Year and Christmas are all approaching. These traditionally spur gold prices on, and there is the possibility that one legacy of Covid will be consumers shifting back into traditional gift-giving.
Gold & Inflation
All of these moves are happening against a backdrop of inflationary pressure building in the global economy. A series of crucial data points have recently pointed towards surprisingly high price rises coming into play. Supply-side logjams may resolve themselves and result in the inflationary pressures being as “transitory” as the US Federal Reserve believes. The point for fans of gold to keep in mind is that the reaction by governments to the Covid crisis was to borrow and spend at unprecedented levels. Inflation would erode that debt pile without governments having to take the unpopular decision of raising taxes or cutting spending. With powerful lobby groups comfortable with dovish monetary policy, the recent price move in gold could be the beginning of a longer-term trend.
If you have been the victim of a scam, suspect fraudulent behaviour, or want to know more about this topic, please contact us at [email protected]
 Between 74-89% of CFD traders lose
  Your capital is at risk
  Your capital is at risk
  Your capital is at risk