
Those who picked out last week as a chance for technical indicators to be applied were pretty much on the money. In a quiet news week, some classic moves came into play, most notably the willingness of equities to creep higher without any apparent reason for them not to. This research note, Keep Trading the Technicals to Take Advantage of a Quiet News Week, could have initiated some profitable, low-drama equity trades.
With few bangs and crashes emanating from the global news desks, the S&P 500 rather methodically squeezed higher, moving from 4,475 to 4,537. The index posted an intra-day all-time-high of 4,559 on Friday but closed below the previous record close of 4,535 on the 30th of August. That inability to close higher is a sign that the bulls might not have things all their own way in the coming week.
S&P 500 Index Price Chart – Daily Candles – Steady Climb & Doji
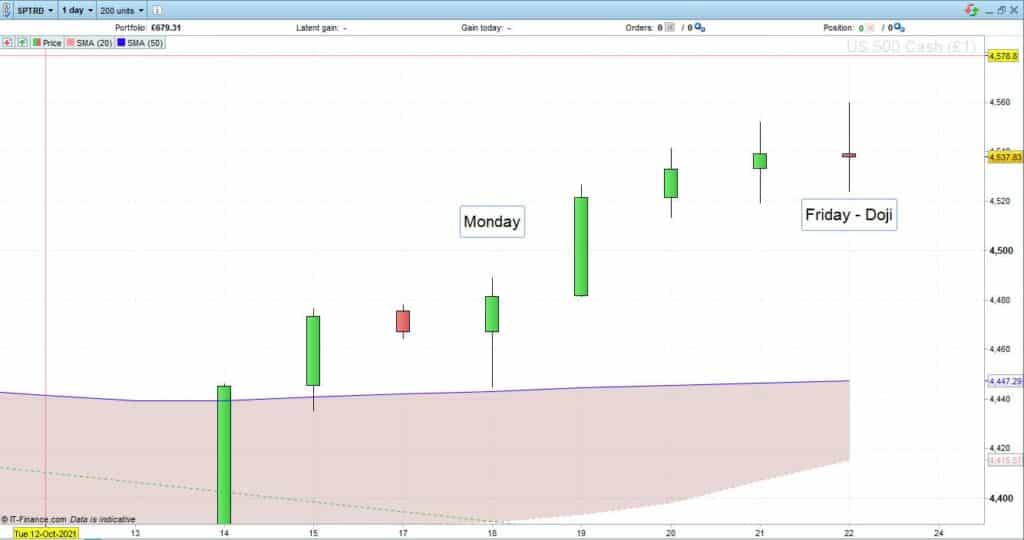
Source: IG
The four green candles posted between Monday and Thursday were impressive enough, but Friday’s red daily doji candle is hanging on the chart as a warning sign that momentum could be about to change. Another cautionary metric is the declining trading volumes seen on the weekly chart – the last time they were this low was back at the end of August, when that previous all-time-high close was posted – prior to the index giving up more than 5% in value in September.
S&P 500 Index Price Chart – Weekly Candles and Declining Volumes
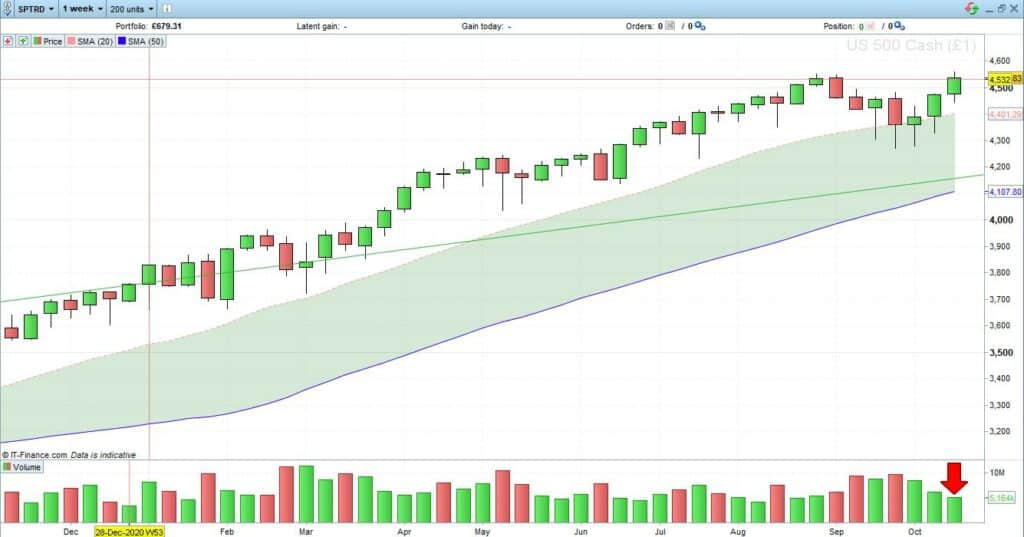
Source: IG
The alarm bells ringing for the S&P 500 are more muted on the Dow Jones Industrial Average price charts. That index closed at an all-time high on Friday and posted its third positive week in a row. This could point to the rotation into cyclical stocks continuing to be the major underlying trend of Q3 and Q4. More on that trading idea can be found on the analyst’s research note from the 28th of September – Bond Market Signals Rotation Could Be Starting and Technicals Back it Up.
Dow Jones Industrial Average Index Price Chart – Daily Candles – All-Time High
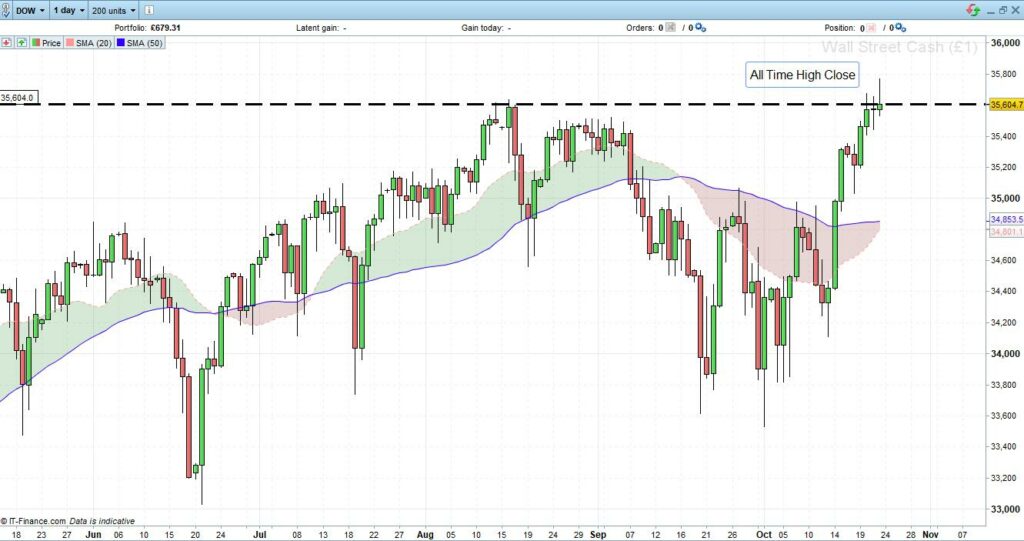
Source: IG
With two of the world’s major equity indices giving off slightly mixed messages, there is an obvious benefit in factoring in data from the tech-heavy Nasdaq 100.
This index posted its current closing high (15,678) on the 7th of September. For tech stocks, the summer strength lasted one week longer than for the broader S&P 500. Unfortunately, for those who held onto Nasdaq long positions, the price slide has also persisted for a more extended period.
Nasdaq 100 Price Chart – Daily Candles – Below All-Time High
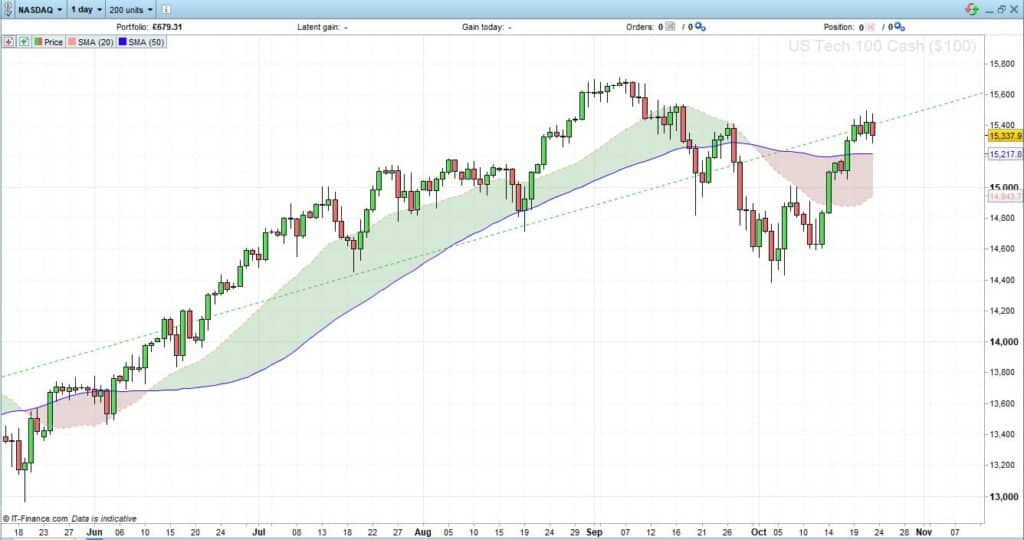
Source: IG
The Nasdaq 1 Day chart shows price punched through the 50 Simple Moving Average at the start of last week – then flatlined. Tech stock prices sit some way off their all-time highs, and volume in this market has also fallen away.
Nasdaq 100 Price Chart – Daily Candles – Falling Volumes
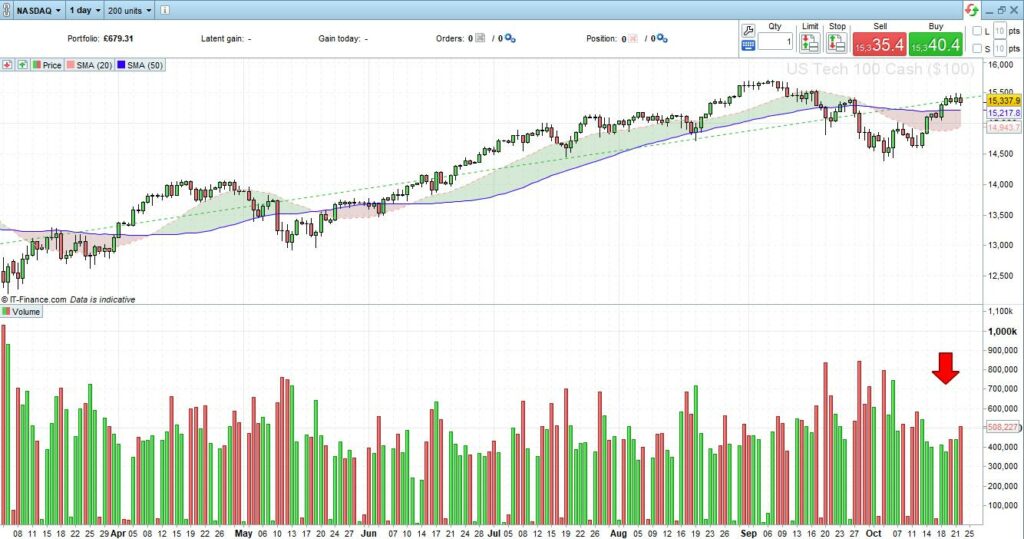
Source: IG
If the previous week was one in which to embrace technical indicators, then the coming one looks like a case study in waiting for direction to be clearly stated.
If you have been the victim of a scam, suspect fraudulent behaviour, or want to know more about this topic, please contact us at [email protected]
 Your capital is at risk
  Your capital is at risk