Risk-on assets have started Monday’s trading sessions by consolidating the significant gains they made last week. Overnight in Asia, there were mixed reports, with Chinese and Hong Kong stock indices weakening, while those in Tokyo and Australia are showing strength.
The divergence between those markets doesn’t appear to be causing any significant concerns. On what is a quiet news day, analysts may wait for the US to open before making their next move, but a lot of attention is turning to the UK markets.
The relatively conservative FTSE 100 outstripped Bitcoin in terms of price increases last week as a trend grows to buy into UK stocks that have been underperforming other major indices for more than 12 months. Sterling’s break of the 1.40 GBPUSD price barrier adds to the feeling that global cash piles are surging into UK markets.
| Instrument | 3rd May | 10th May | Hourly | Daily | % Change | |
| GBP/USD | 1.3806 | 1.4055 | Strong Buy | Strong Buy | 1.80% | |
| EUR/USD | 1.2010 | 1.2153 | Neutral | Strong Buy | 1.19% | |
| FTSE 100 | 6,961 | 7,155 | Strong Buy | Strong Buy | 2.79% | |
| S&P 500 | 4,189 | 4,237 | Strong Buy | Strong Buy | 1.15% | |
| Gold | 1,773 | 1,837 | Strong Buy | Strong Buy | 3.61% | |
| Silver | 2,590 | 2,774 | Strong Buy | Strong Buy | 7.10% | |
| Crude Oil WTI | 63.14 | 65.39 | Strong Buy | Strong Buy | 3.56% | |
| Bitcoin | 57,908 | 59,045 | Strong Buy | Buy | 1.96% |
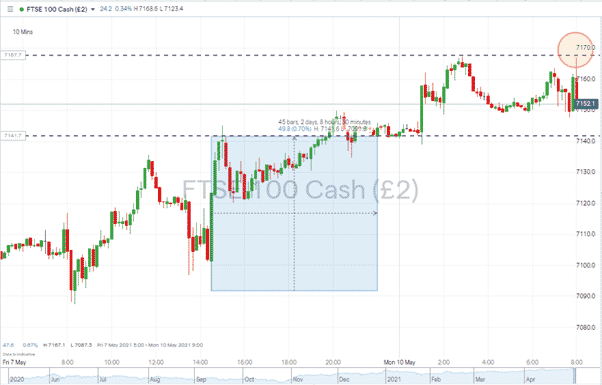
On Friday evening, the close in New York saw futures in the FTSE 100 increase in value by 0.70% in the space of a few hours. All other global exchanges had already closed for the week, so it was a bold step for US investors to turn so bullish single-handedly. During the early hours of Monday’s trading sessions, those price hikes have held firm. The bulls currently don’t need too much of an excuse to pile into the UK’s benchmark index and will be looking for a break to the upside from the relatively tight price range between Friday’s close and the current week-to-date high. The 10-minute price chart shows the 7167 resistance level being tested in the crucial opening minutes of London trading. The path of least resistance appears to be upwards; however, the air is getting thin. Short-term technical indicators point to a break of the 7141 support being the more likely scenario, which could trigger a short-term sell-off.
FTSE 100 Key indicators:
- Week to date price high – 7167
- Friday close of FTSE 100 Futures – 7141
FTSE 100 10-minute price chart – Friday Rally & Opening Bell

Source: IG
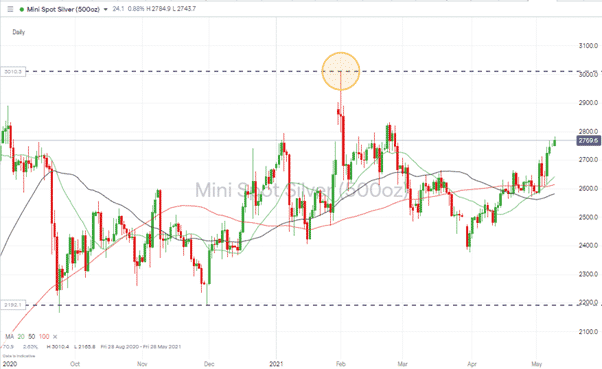
Price moves in UK markets might make them the focus of attention, but EURUSD, S&P 500, Bitcoin and Crude were all positive on the week. From a Macro perspective, the moves in the precious metal markets point to a realignment of risk appetite taking place, which demands consideration.

Source: IG
Demand for the US minted American Eagle silver coins has, in the first four months of 2021, outstripped total sales of the coins in all of 2019. Retail investors are piling into the market at a time when supply can’t keep up with demand. Mining and exploration budgets were scaled back during the Covid pandemic. Healthy balance sheets were needed to weather the economic uncertainty, and healthy miners couldn’t be expected to work close to each other. The spike to $30 in February was attributed to Reddit chat groups generating fake news, but a re-test of that level, based on fundamentals, can’t be ruled out.
If you want to know more about this topic, please contact us at [email protected]
 Between 74-89% of CFD traders lose
  Your capital is at risk
  Your capital is at risk
  Your capital is at risk