
FOCUS ON: Dollar Tests Long-Term Support To Open Up New Trading Opportunities
- China’s selling pressure forces the US dollar to test long-term technical support levels
- While further USD strength can’t be discounted, the move has brought new trade entry points into play
- Key forex pairs are now at pivot points
Last week, intervention by China’s authorities jolted the US dollar out of its upward trajectory. The question being asked by forex traders is whether this signals the end of 2022s most significant trend.
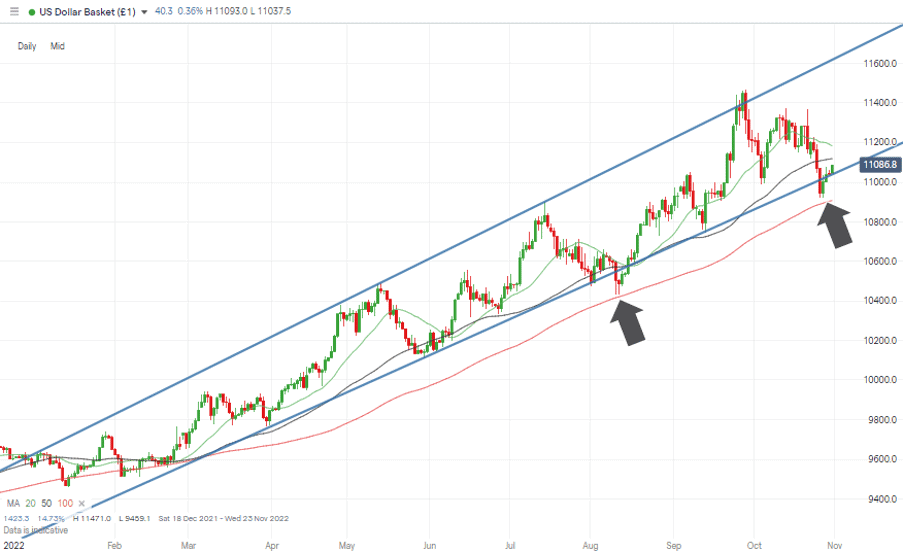
The rise of the dollar has been a dominant feature thanks to the multi-month nature of the move and also the momentum’s consistency. By the end of September, the US Dollar Basket Index (DXY) had increased in value by almost 20% on a year-to-date basis. In addition, its upward price channel had, until last week, only been tested once, when price broke below the supporting trendline in August.
US economic growth continues to be confirmed by each new set of data released. Those strong fundamentals point to the Fed being justified in its hawkish approach towards tackling inflation. It also marks the US economy as one that international investors want to buy into. So, with rates rising and prospects improving, the pullback in DXY during last week needs some explaining.
Most analysis relating to the surprise move notes that the main currency to benefit from the sale of dollars was the Chinese renminbi, the best-performing currency within the G20 group of countries. Its outperformance is an interesting development given the way the currency is pegged and typically has a lower beta than other major currency pairs.
This points to dollar weakness resulting from a directive by Beijing requiring state-owned banks to sell dollars and buy the local currency. The move is reported by Reuters to have encompassed domestic and international currency markets and to have been implemented late on Tuesday 25th October. A theory backed up by the price charts, the move in DXY from Tuesday’s high of 11,193.4 to Wednesday’s low of 10,922.5 represents a 2.42% slide in value.
The reasons for Chinese intervention are less clear, with traders suggesting a desire to prop up China’s currency which had softened due to extended Coronavirus lockdowns harming industrial production levels. Whatever the motives, it’s a move which needs monitoring. Jordan Rochester, an analyst at Nomura, described the situation as “chaos” and that “the flows and narratives [are] contradicting each other.”
The Beijing directive came during a week which was already jam-packed with key data releases. The Bank of Canada, ECB, and Bank of Japan updated their respective interest rate policies. In the stock market, tech giants Alphabet, Meta, Microsoft, Twitter, Apple and Amazon also released their Q3 earnings.
US Dollar Basket Chart – Daily Candles – Trendline Break And Recovery
Source: IG
Also read: What is the USD Index?
The intervention by Beijing has demonstrated China’s ability to move the markets – it’s hard to bet against a country which owns so much of the world’s wealth. It also means traders face a new range of technical indicators in the current trading week.
Instrument | Price | Hourly | Daily |
EUR/USD | 0.9835 | Neutral | Neutral |
GBP/USD | 1.1336 | Buy | Neutral |
USD/JPY | 149.19 | Strong Buy | Strong Buy |
S&P 500 | 3,742 | Strong Buy | Buy |
NASDAQ 100 | 11,280 | Strong Buy | Buy |
FTSE100 | 6,942 | Strong Buy | Sell |
Gold | 1,650 | Sell | Strong Sell |
Crude Oil WTI | 83.67 | Strong Sell | Strong Sell |
Bitcoin | 19,350 | Buy | Sell |
Ethereum | 1,342 | Buy | Strong Sell |
UTC: 09:44
Our trading signal analysis is based on a comprehensive summary of market data. We use a range of metrics with weighting given to simple and exponential moving averages and key technical indicators.
We created this Weekly Tips section to share possible trade entry and exit points based on our technical analysis. We also have other methods to validate our trades which we can’t publicly share that help to increase their success. All our trades include entry and at least one target price. Stop losses are applied at the reader’s discretion. Our strategies typically trade with a wide stop loss, and risk is further mitigated by trading in small sizes.
Forex
GBPUSD
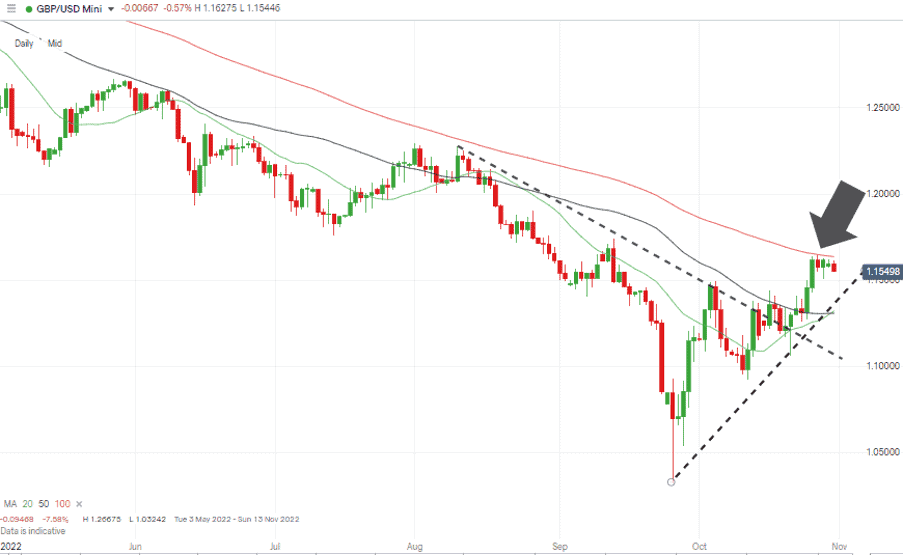
Rishi Sunak’s appointment as the new prime minister coincided with the China-induced sell-off in the US dollar. That combination of factors resulted in GBP rising from a low of 1.1271 on Tuesday to a high of 1.16389 on Wednesday.
Sunak’s career history includes stints at Goldman Sachs and hedge funds, and his mandate, based on financial prudence, is going down well with UK investors.
GBPUSD Chart – Daily Candles – 100 SMA Resistance
Source: IG
The latest in a series of emergency budgets due to be delivered on Monday 31st October has been pushed back by more than two weeks to 17th November. Analysts suggest the delay reflects that either Sunak is intent on getting a better grip on the figures before decisions are made, or he and the Chancellor are hoping for UK economic forecasts to take an upward turn.
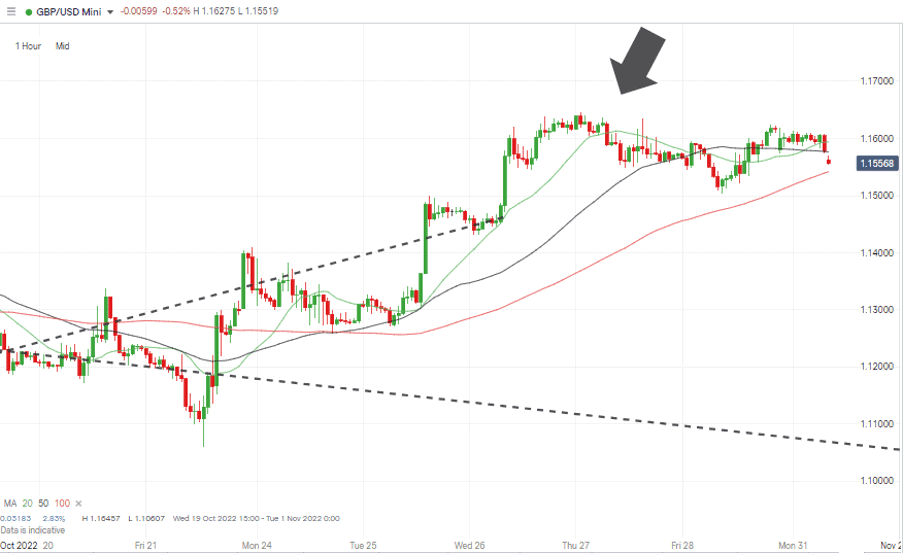
GBPUSD Chart – Hourly Candles – Bounce to the Upper Trendline
Source: IG
The Daily Price Chart price has traded below the key 100 SMA resistance level for four consecutive trading sessions. A period of consolidation would be expected after GBPUSD posted a week-on-week price gain of 1.96%, with the question now being if it can carry on and push through that key metric.
Short positions
- Entry Level 1: 1.16363 – Region of the 100 SMA on the Daily Price Chart. The last time price closed above this metric was 23rd February 2022, so it can be expected to provide stiff resistance.
- Price Target 1: 1.13222 – Region of the convergence of the 20 and 50 SMA on the Daily Price Chart. Also, the region of supporting trendline of upward price move started on 26th September
- Stop Loss: > 1.200 – Psychologically important ’round number’ price level.
Long positions
- Entry Level 1: 1.16363 – Applying a breakout strategy to capture further upward price moves if price does manage to break through the 100 SMA on the Daily Price Chart.
- Price Target 1: 1.200 – Psychologically important ’round number’ price level.
- Stop Loss: < 1.13222 – Region of the 20 and 50 SMA on the Daily Price Chart and supporting trendline.
EURUSD
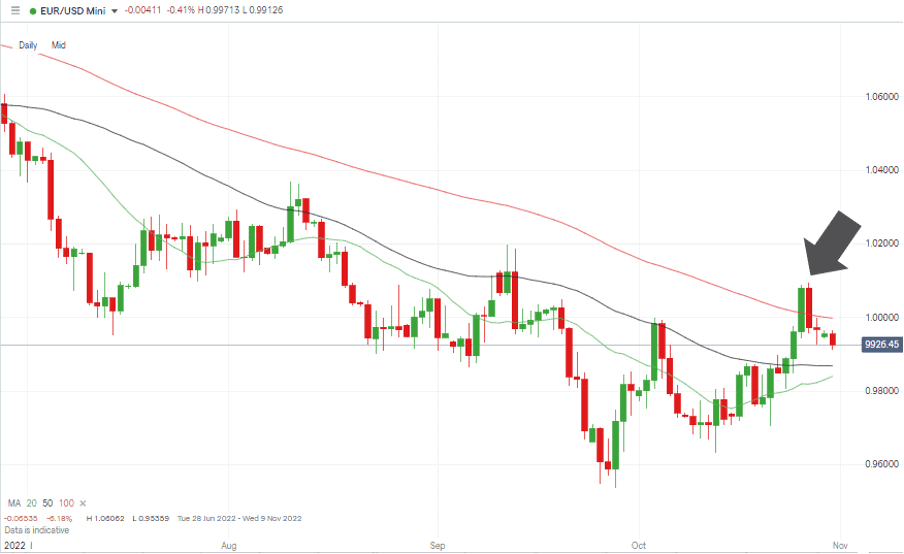
The ECB’s decision on Thursday to increase euro interest rates by 75 basis points had been widely expected. In what looks like a classic case of ‘buy the rumour, sell the fact’, EURUSD weakened during Thursday’s trading session and was fuelled by the dovish guidance which accompanied the rise in rates of 0.75%
Energy fears have subsided thanks to unseasonably warm weather and stockpiles nearing capacity, but the outlook for the eurozone economies remains weak.
EURUSD Chart – Daily Candles – Break Above Parity And Retreat
Source: IG
Christine Lagarde, President of the ECB, refused to be drawn on making too many predictions regarding the size of future rate rises, saying: “We are turning our backs to forward guidance to avoid uncertainty.” That was interpreted as a dovish approach which would give more room for weak fundamentals to be accounted for as much as inflationary pressures.
EURUSD Chart – Hourly Candles – Break Above Parity And Retreat
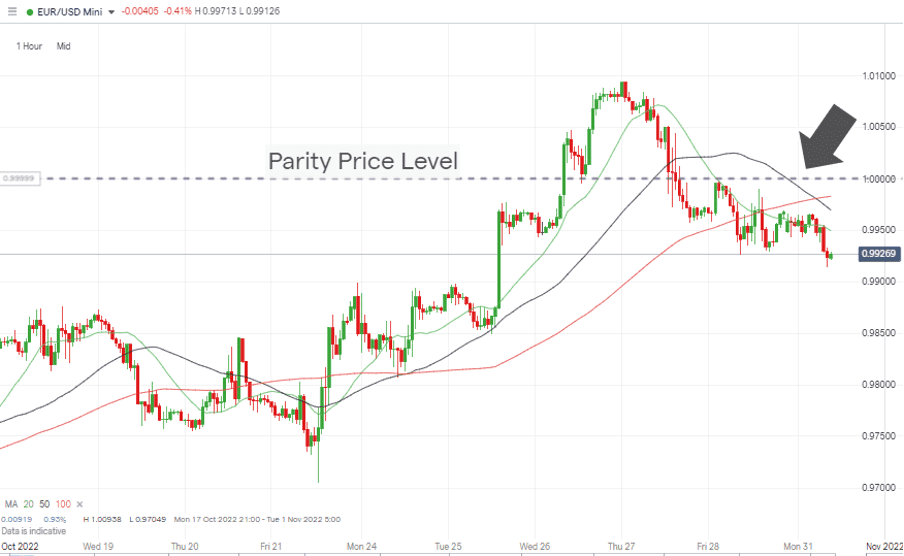
Source: IG
Wednesday’s price surge in EURUSD took it to an intraday high of 1.00889 and broke through the 100 SMA on the Daily Price Chart and above the parity price level. Subsequent weakness saw the Eurodollar return to trading below both key resistance levels and start the week of 31st October trading in the region of 0.9917.
Short positions
- Entry Level 1: 0.99982 – Region of the 100 SMA on the Daily Price Chart and the psychologically important parity price level.
- Price Target 1: 0.98685 – Region of the 50 SMA on the Daily Price Chart.
- Price Target 2: 0.98404 – Region of the 20 SMA on the Daily Price Chart.
- Stop Loss: > 1.000 – Parity price level.
Long positions
- Entry Level 1: 0.98685 – A pullback and retest of parity can’t be discounted. The 50 SMA on the Daily Price Chart being a support level at which long positions could be entered.
- Price Target 1: 0.99982 – Region of the 100 SMA.
- Price Target 2: 1.000 – Parity price level.
- Stop Loss: < 0.98404 – Region of the 20 SMA on the Daily Price Chart.
Indices
NASDAQ 100
Microsoft, Alphabet, Twitter, Spotify, Meta, Apple, and Amazon released their Q3 earnings reports last week, with the vast data dump leading to the NASDAQ 100 posting a 1.64% gain. Optimism might be returning to the stock markets, but the at least relatively bad news for tech stock investors is that ‘traditional’ stocks posted more significant gains. The S&P 500 index recorded a 3.69% return over the same period.
NASDAQ 100 Chart – Daily Candles – Double-bottom?
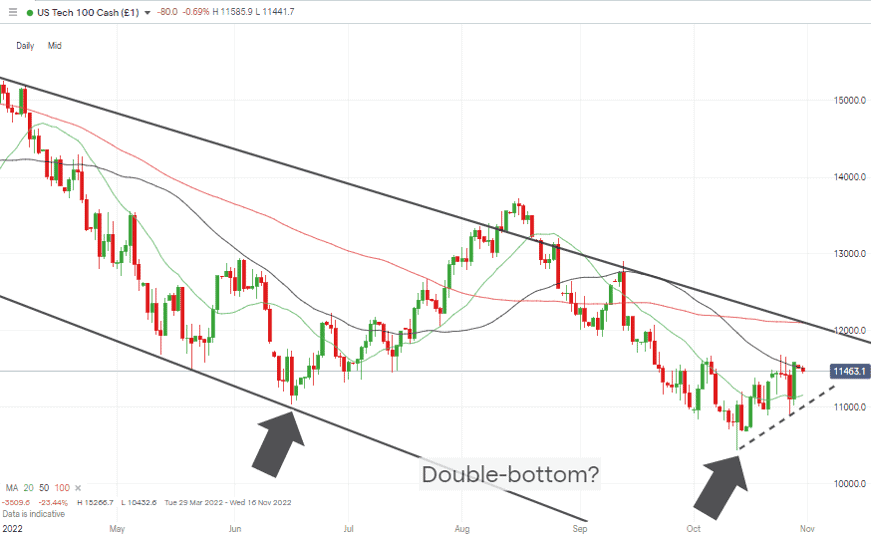
Source: IG
While absolute returns might be lagging behind those of other indices, the price move does keep the double-bottom price pattern intact. A break of the 50 SMA on the Daily Price Chart is the next target for those backing stocks to show further upward momentum.
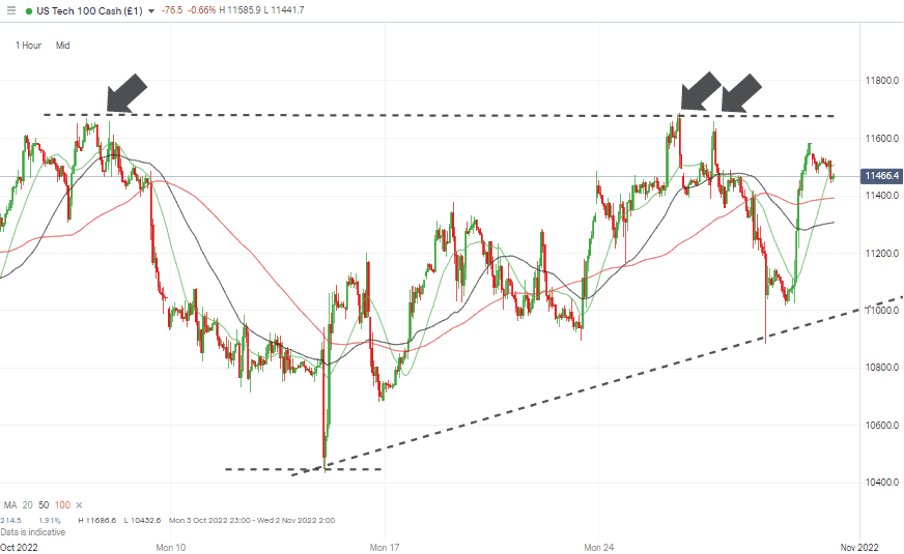
NASDAQ 100 Chart – Hourly Candles – Resistance at 11,668
Source: IG
Short positions
- Entry Level 1: 11,668 – Price high of Thursday 20th October, now forms resistance with attempted breaks on 25th and 26th October failing to make further upward progress. Also, the region of the 50 SMA on the Daily Price Chart.
- Price Target 1: 10,432 – Year to date price low printed on Thursday 13th October.
- Price Target 2: 10,000 – Round number price level.
- Stop Loss: >12,101 – Region of the 100 SMA on Daily Price Chart.
Long positions
- Entry Level 1: 11,668 – Applying a breakout strategy based on the big names of the Q3 earnings season having already released their results and expectation that a period of quieter news flow might allow stocks to build upward momentum.
- Price Target 1: 12,000 – Psychologically important price level and region of the upper trendline of the year-long downward price channel.
- Stop Loss: < 11,156 – Region of the 20 SMA on the Daily Price Chart and supporting trendline of rally dating from 13th October.
Crypto – Bitcoin & Ethereum
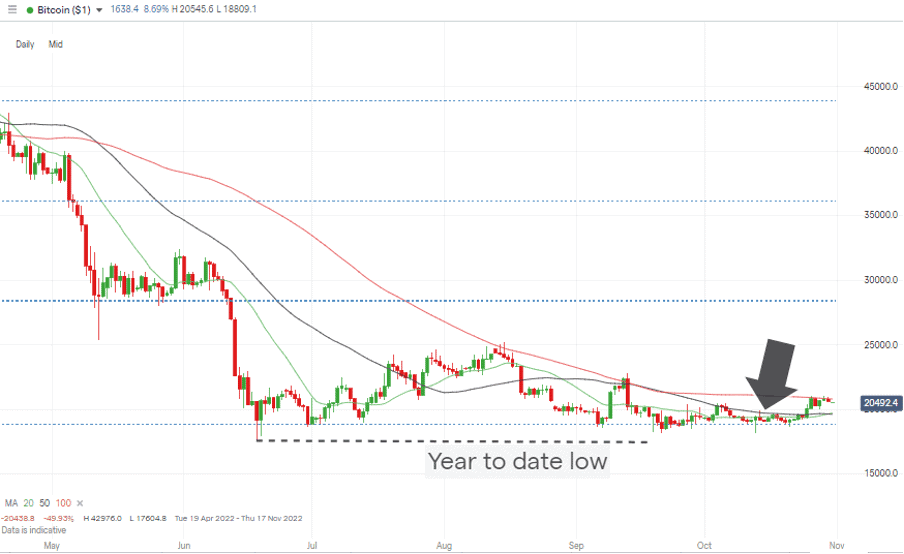
After several weeks of range-bound price action, Bitcoin and Ethereum surged through key resistance levels to trade at prices last seen in mid-September. The rally’s timing coincided with the shift out of the US dollar, with Ether increasing in value by almost 20% during Tuesday and Wednesday’s trading sessions.
Bitcoin’s 9.2% price increase over the same period might look relatively weak compared to the progress made by Ether, but the gains symbolise that the crypto markets could be on the move again. Both coins reached the price targets identified in the ForexTraders Weekly Forex Trading Tips report of 24th October and tested the 100 SMA on their respective Daily Price Charts.
Those SMAs are key metrics and can be expected to provide significant resistance/support, but as important is the break of the downward trendlines both coins have been guided by for much of the year.
Bitcoin Price Chart – Daily Candles – Testing The 100 SMA
Source: IG
Bitcoin Long positions
- Entry Level 1: 20,816 – Region of the 100 SMA on the Daily Price Chart. A break above this metric would leave room for upward momentum to continue to build.
- Price Target 1: 22,778 – Price high of 13th September 2022.
- Price Target 2: 28,205 – 61.86% Fibonacci retracement support/resistance level of 2019 – 2022 bull market.
- Stop Losses: < 20,000 – Psychologically important price level.
Ethereum
Ethereum Chart – Daily Candles – Break of the 100 SMA
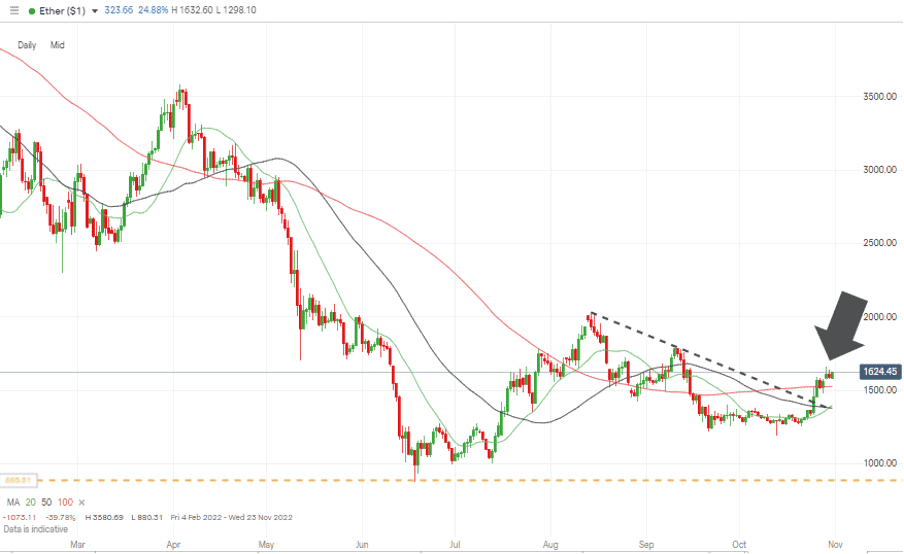
Source: IG
Ethereum Long positions
- Entry Level 1: 1,526 – Region of the 100 SMA on the Daily Price Chart. Buying into any short-term weakness.
- Price Target 1: 1,789 – Price high of 11th September 2022.
- Price Target 2: 2,598 – On extension, region of the 20 SMA on the Monthly Price Chart.
- Stop Losses: < 880 – Price low of 17th June 2022.
Risk Statement: Trading financial products carries a high risk to your capital, especially trading leverage products such as CFDs. They may not be suitable for everyone. Please make sure that you fully understand the risks. You should consider whether you can afford to take the risk of losing your money.

Forextraders' Broker of the Month
BlackBull Markets is a reliable and well-respected trading platform that provides its customers with high-quality access to a wide range of asset groups. The broker is headquartered in New Zealand which explains why it has flown under the radar for a few years but it is a great broker that is now building a global following. The BlackBull Markets site is intuitive and easy to use, making it an ideal choice for beginners.