
FOCUS ON: How Will One Of The Busiest News Weeks Of The Year Impact Prices
- A busy news week sees three central banks update the markets on interest rate levels
- US earnings season hits full stride with bellwether stocks such as Meta, Amazon, and Apple releasing their Q3 results
- If there are surprises, will they be enough to break the multi-month trend of a stronger US dollar?
Traders and analysts are braced for one of the busiest news weeks of the year. The ECB will update markets regarding its interest rate policy on Thursday, with the Bank of Canada and Bank of Japan doing the same on Tuesday and Friday, respectively.
Microsoft, Twitter, Spotify and Alphabet lead a flurry of company Q3 earnings reports. Those tech giants report on Tuesday and are followed by Apple and Amazon, which release their updates on Thursday.
Even relatively minor reports could move the markets. US consumer confidence figures are released on Tuesday, Australia CPI on Wednesday, US new home sales numbers come out on Thursday, and Germany and France inflation reports are due on Friday.
The extra market noise makes it a good week for day traders, but medium and long-term investors will closely monitor events. This could be the week we begin to see signs that the big trend of 2022, the rush to the US dollar, might be about to unravel.
US Dollar Basket Chart – Daily Candles – Mid-Channel
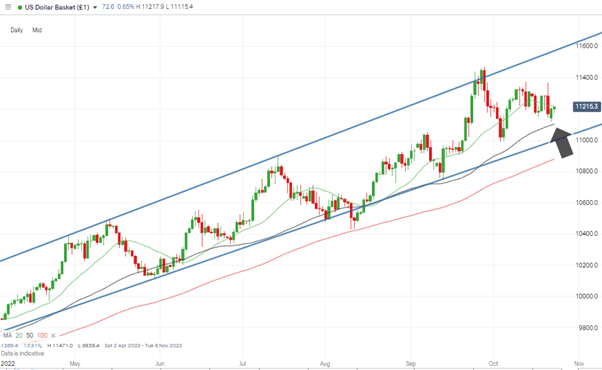
Source: IG
Also read: What is the USD Index?
We have been here before. The outstanding rise in the value of the US Dollar Basket index through 2022 did suffer a blip in August when price broke the supporting trendline to touch the 100 SMA on the Daily Price Chart. It soon regained its upward momentum, and betting against USD has been a losing trade since the start of the year.
All trends do come to an end, and the price of the US Dollar Index has, over the last seven trading sessions, spent at least part of the day trading below the 20 SMA. That’s the first time since August that it has happened for more than four consecutive days.
Instrument | Price | Hourly | Daily |
EUR/USD | 0.9835 | Neutral | Neutral |
GBP/USD | 1.1336 | Buy | Neutral |
USD/JPY | 149.19 | Strong Buy | Strong Buy |
S&P 500 | 3,742 | Strong Buy | Buy |
NASDAQ 100 | 11,280 | Strong Buy | Buy |
FTSE100 | 6,942 | Strong Buy | Sell |
Gold | 1,650 | Sell | Strong Sell |
Crude Oil WTI | 83.67 | Strong Sell | Strong Sell |
Bitcoin | 19,350 | Buy | Sell |
Ethereum | 1,342 | Buy | Strong Sell |
UTC: 09:42
Our trading signal analysis is based on a comprehensive summary of market data. We use a range of metrics with weighting given to simple and exponential moving averages and key technical indicators.
We created this Weekly Tips section to share possible trade entry and exit points based on our technical analysis. We also have other methods to validate our trades which we can’t publicly share that help to increase their success. All our trades include entry and at least one target price. Stop losses are applied at the reader’s discretion. Our strategies typically trade with a wide stop loss, and risk is further mitigated by trading in small sizes.
Forex
GBPUSD
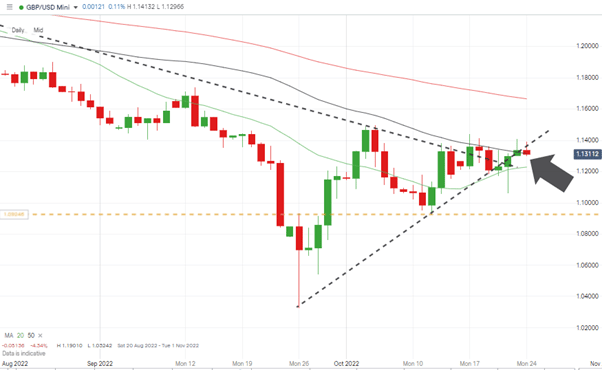
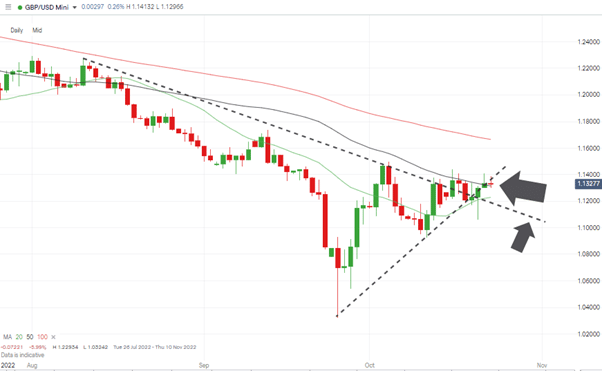
The Forex Traders Trading Ideas Report of 17th October highlighted the path GBPUSD was taking into the funnel end of a sideways wedge-pattern. Price ultimately broke to the upside and has so far used the lower trendline as support for its continued upward movement.
GBPUSD Chart – Daily Candles – Wedge Pattern Forming
Source: IG
Increased political certainty played a part in determining whether cable broke to the upside or downside. Rishi Sunak’s move towards becoming the next leader of the Conservative Party and Prime Minister of the country has been broadly welcomed by the markets, and GBPUSD is now trading in the region of the key 50 SMA on the Daily Price Chart.
GBPUSD Chart – Hourly Candles – Bounce to the Upper Trendline
Source: IG
The Daily Price Chart shows a similar situation to the one highlighted in the Forex Traders Trading Ideas Report of 17th October. Price is still trading between the 20 and 50 SMAs on the Daily Price Chart. A move through the resistance offered by the 50 SMA can’t be guaranteed but would signal a switch to more bullish price action.
Short positions
- Entry Level 1: 1.13152 – Region of the 50 SMA on the Daily Price Chart. The last time price closed above this metric was 16th August 2022, so it can be expected to provide stiff resistance.
- Price Target 1: 1.12293 – Region of the 20 SMA on the Daily Price Chart and the end of the funnel of the sideways wedge pattern.
- Price Target 2: 1.03232 – Price low of 26th October 2022. Year-to-date price low.
- Stop Loss: > 1.17383 – Price high of 13th September 2022 and region of the 100 SMA on the Daily Price Chart.
Long positions
- Entry Level 1: 1.13152 – Region of the 50 SMA on the Daily Price Chart. Using the metric as a support level for a breakout strategy designed to capture further upside momentum.
- Price Target 1: 1.17383 – Price high of 13th September 2022 and region of the 100 SMA on the Daily Price Chart.
- Stop Loss: < 1.1000 – Round number support level and region of the trendline which formed the upper end of the sideways wedge pattern but following the breakout now offers support.
EURUSD
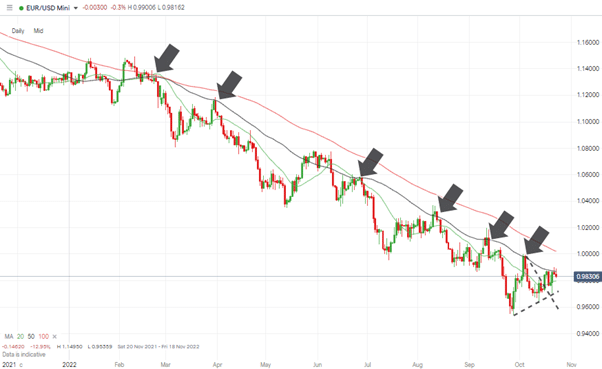
A big week for Eurodollar traders will be capped off by the ECB giving their latest update on interest rate policy on Thursday. The market is currently pricing in a 75-basis point increase in the base rate, which is a relatively hawkish move by the bank but still only matches the approach of its US counterpart.
EURUSD Chart – Daily Candles – Long-Term Downward Trend & 50 SMA
Source: IG
Investors have been flocking to the dollar not only because of the higher interest rates on offer but also because of the strength of the US economy. The ECB faces a different challenge, with the weaker eurozone economic prospects. That leaves less room for further rate rises and ultimately caps how far EURUSD can move to the upside.
EURUSD Chart – Hourly Candles – Trading Range
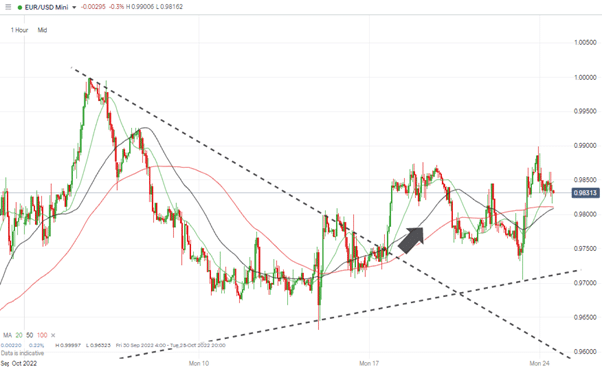
Source: IG
The breakout of the sideways wedge pattern identified last week was to the upside, but the Hourly Price Chart reflects that move failed to gain meaningful momentum. The 50 SMA on the Daily Price Chart has rebuffed upward price movement on six occasions during 2022. It looks like the metric that price needs to break through if a rally is to be confirmed. With geopolitical risk and energy supply still a concern, a push through that 50 SMA and a test of the parity price level would reflect a significant change in market sentiment.
Short positions
- Entry Level 1: 0.98686 – Region of the 50 SMA on the Daily Price Chart. Also, just below the psychologically important parity price level.
- Price Target 1: 0.97657 – Region of the 20 SMA on the Daily Price Chart.
- Price Target 2: 0.96323 – Price low of 13th October 2022. A break of this swing-low would signal the capitulation of the upward trend, which started on 28th September 2022.
- Stop Loss: > 1.000 – Parity price level.
Long positions
- Entry Level 1: 0.97049 – Price low of 21st October and region of the trendline which formed the upper end of the sideways wedge until 20th October, which now offers support.
- Price Target 1: 0.97657 – Region of the 20 SMA on the Daily Price Chart.
- Price Target 2: 0.98686 – Region of the 50 SMA on the Daily Price Chart
- Stop Loss: < 0.96323 – Price low of week commencing 13th October 2022.
Indices
NASDAQ 100
A massive week for NASDAQ stocks gets up to full speed on Tuesday when Microsoft, Alphabet, Twitter, and Spotify release their Q3 earnings reports. Tech stocks reporting later in the week include Meta (Wednesday), Apple, and Amazon (Thursday).
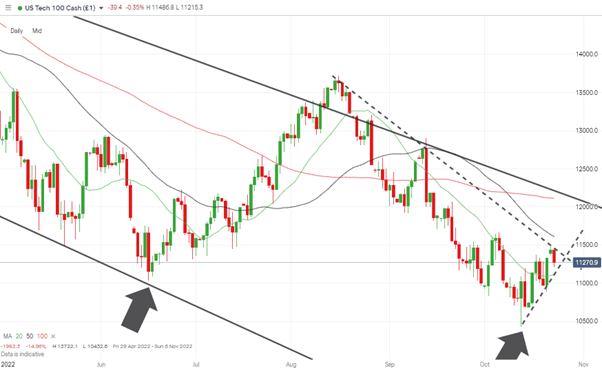
NASDAQ 100 Chart – Daily Candles – Double-bottom?
Source: IG
Growth stocks have been particularly badly hit by the threat of inflation and how it eats into consumer spending, and the Q3 results will offer an insight into the health of the global consumer. Any signs of strength could help the price of the NASDAQ 100 consolidate as it potentially forms a double-bottom price pattern.
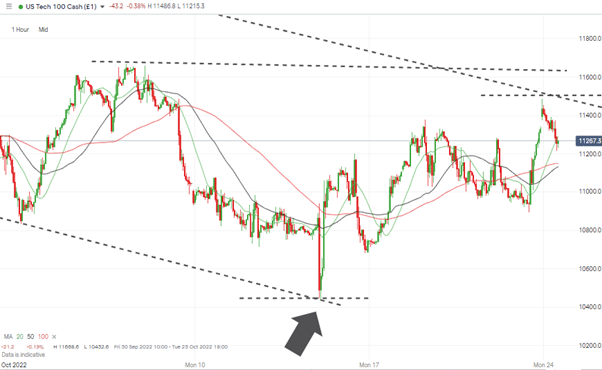
NASDAQ 100 Chart – Hourly Candles – 20, 50, and 100 SMAs in Bullish Alignment
Source: IG
Short positions
- Entry Level 1: 11,668 – Price high of Thursday 20th October, upper end of downward price channel started on 16th August 2022, and region of 50 SMA on the Daily Price Chart.
- Price Target 1: 10,432 – Year to date price low printed on Thursday 13th October.
- Price Target 2: 10,000 – Round number price level.
- Stop Loss: >12,112 – Region of the 100 SMA on Daily Price Chart and upper resistance trendline of downward channel started in January 2022.
Long positions
- Entry Level 1: 11,113 – Region of the 20 SMA on the Daily Price Chart and supporting trendline of the mini-rally started on 13th October.
- Price Target 1: 11,638 – Price high of Thursday 20th October, upper end of downward price channel started on 16th August 2022, and region of 50 SMA on the Daily Price Chart
- Stop Loss: < 10,432 – Year to date price low printed on Thursday 13th October.
Crypto – Bitcoin & Ethereum
The week-on-week price moves made by Bitcoin and Ethereum may be small in numerical terms, but they have helped both leading cryptos confirm bullish technical patterns.
Both are trading above their 20 SMA’s on the Daily Price Chart rather than just tracking that metric. For both coins, that now brings the 50 SMA on the Daily Price Chart into view. That level can be expected to provide stiff resistance, but a break of it would signal a turnaround in the sector’s prospects.
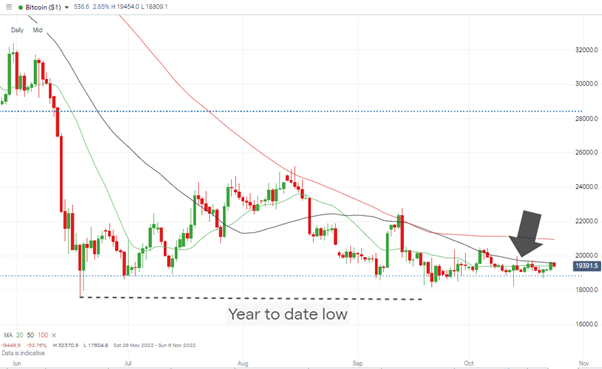
Bitcoin Price Chart – Daily Candles – Trading Above The 20 SMA
Source: IG
Bitcoin Long positions
- Entry Level 1: 19,579 – Region of the 50 SMA on the Daily Price Chart. A break above this metric could signify a breakout pattern forming.
- Price Target 1: 20,000 – In extension, psychologically important price level.
- Price Target 2: 20,936 – In extension, 100 SMA on the Daily Price Chart.
- Stop Losses: < 17,604 – Year-to-date price low printed on 18th June 2022.
- Ethereum
Ethereum Chart – Daily Candles – Trading Above The 20 SMA
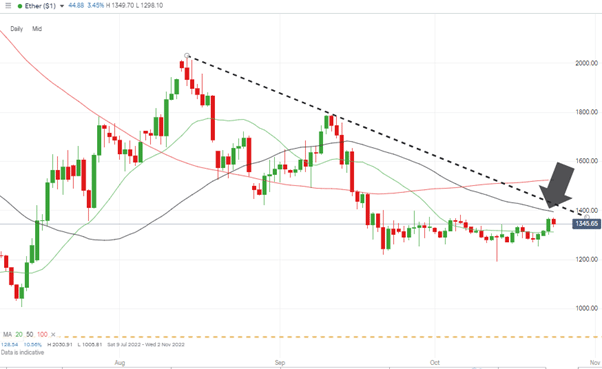
Source: IG
Ethereum Long positions
- Entry Level 1: 1,394 – Region of the 50 SMA on the Daily Price Chart. Waiting for confirmation that this resistance level has been breached before entering into a momentum-based strategy.
- Price Target 1: 1,416 – Region of the downward trendline dating back to 14th August 2022.
- Price Target 2: 1,523 – Region of the 100 SMA on the Daily Price Chart and just above the psychologically important $15k price level.
- Stop Losses: < 880 – Price low of 17th June 2022.
Risk Statement: Trading financial products carries a high risk to your capital, especially trading leverage products such as CFDs. They may not be suitable for everyone. Please make sure that you fully understand the risks. You should consider whether you can afford to take the risk of losing your money.

Forextraders' Broker of the Month
BlackBull Markets is a reliable and well-respected trading platform that provides its customers with high-quality access to a wide range of asset groups. The broker is headquartered in New Zealand which explains why it has flown under the radar for a few years but it is a great broker that is now building a global following. The BlackBull Markets site is intuitive and easy to use, making it an ideal choice for beginners.