
FOCUS ON: Better Than Expected US Inflation Report Triggers Rush Into Risk
- Year-end rally ignited by US inflation data suggesting the worst could be over
- Hopes of an economic soft-landing result in a surge of buying activity in risk-on assets
- The US dollar is the big loser as analysts try to establish if the major trend of 2022 is about to experience a reversal
Traders go into a week packed with important data releases and risk appetite going through a seismic shift. After ten months of dollar strength, we could be about to see a move to risk-on currencies and stocks. All trends have a bend at the end.
The softer-than-expected US inflation numbers released last week reported that the US CPI index increased by 0.4% in October and 7.7% on a year-on-year basis. Analysts’ expectations had predicted 0.6% and 7.9%.
That was enough to trigger a rush towards risk-on assets, with GBPUSD and EURUSD posting week-on-week gains of 4.06% and 3.85%, respectively. It was the same story in the stock markets, with the S&P 500 up 5.79% on the week and the NASDAQ 100 posting an 8.59% gain.
In commodity markets, gold gained value by 5.38%, with crude oil prices being the surprising exception to the general rebound. The CPI number suggests interest rates might be set to be trimmed back and economic growth prospects are improving. Despite this, oil prices slumped and posted a 3.09% week-on-week fall.
The market-wide change in outlook resulted in the US Dollar Basket index tumbling out of its ten-month-long upward price channel. It now trades below the support/resistance offered by the 20, 50 and 100 SMA’s on the Daily Price Chart and given the confirmed nature of the break, the path of least resistance appears to be downward.
US Dollar Basket Chart – Daily Candles – Break Of Trendline Support
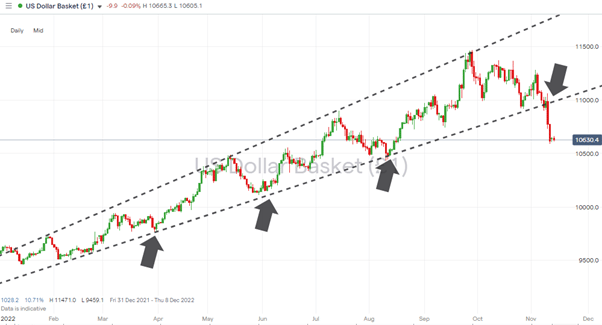
Source: IG
Also read: What is the USD Index?
One note of caution delivered by Christopher Waller of the Fed was that it would take more than one report for the Fed to ease back on its rate-hiking policy. That could mean the current move has fully priced in the CPI data, but the backdrop for the coming week is that we could see a reversal of an almost year-long trend.
With change and uncertainty being the underlying themes, the large number of upcoming data releases look set to lead to increased short-term price volatility.
Instrument | Price | Hourly | Daily |
EUR/USD | 1.0338 | Neutral | Strong Buy |
GBP/USD | 1.1810 | Neutral | Strong Buy |
USD/JPY | 139.42 | Strong Buy | Strong Sell |
S&P 500 | 3,983 | Strong Buy | Strong Buy |
NASDAQ 100 | 11,759 | Strong Buy | Strong Buy |
FTSE100 | 7,365 | Neutral | Strong Buy |
Gold | 1,763 | Strong Sell | Strong Buy |
Crude Oil WTI | 88.27 | Strong Sell | Neutral |
Bitcoin | 16,741 | Buy | Strong Sell |
Ethereum | 1,262 | Buy | Strong Sell |
UTC: 09:26
Our trading signal analysis is based on a comprehensive summary of market data. We use a range of metrics with weighting given to simple and exponential moving averages and key technical indicators.
We created this Weekly Tips section to share possible trade entry and exit points based on our technical analysis. We also have other methods to validate our trades which we can’t publicly share that help to increase their success. All our trades include entry and at least one target price. Stop losses are applied at the reader’s discretion. Our strategies typically trade with a wide stop loss, and risk is further mitigated by trading in small sizes.
Forex
GBPUSD
Sterling’s rebound has taken it from 1.1349 to 1.1810 in one week. A test of the psychologically important 1.20 price level now looks likely. Still, the chances and timing of that will be influenced by UK economic data releases and the situation regarding US inflation.
UK unemployment data will be released at 7 a.m. on Tuesday 15th November. On Wednesday morning, the Consumer Price Index inflation report will offer an insight into UK price rises, and Thursday sees the long-awaited fiscal statement delivered by the new Chancellor, Jeremy Hunt.
GBPUSD Chart – Daily Candles – Upwards Break Out of Sideways Wedge Pattern
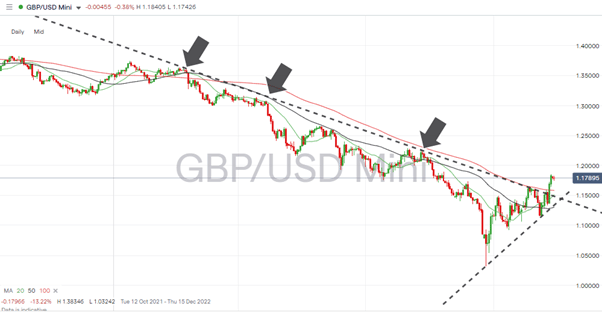
Source: IG
Each of those reports could potentially trigger moves in GBP-related currency pairs making the coming week a busy one for traders of the pound.
GBPUSD Chart – Hourly Candles – Break Out of Wedge Pattern
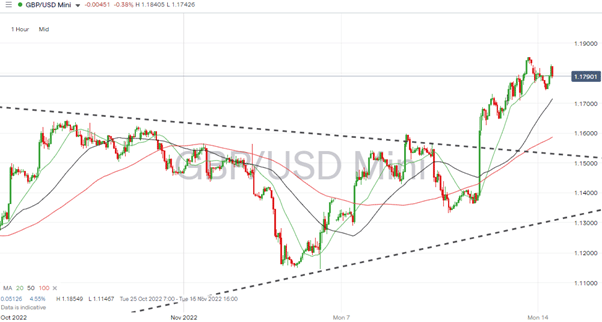
Source: IG
From a technical perspective, the upward break out of the sideways wedge pattern has resulted in GBPUSD trading above all three of the crucial SMAs on the Daily Price Chart. Short-term price action is currently being dictated by the 20 SMA on the Hourly Price Chart, and with that metric beginning to lose momentum, the chance of a near-term pullback can’t be dismissed.
Short positions
- Entry Level 1: 1.17974 – Trading against the underlying trend can be costly, but a break of the 20 SMA on the Hourly Price Chart would offer opportunities for short-sellers running scalping strategies.
- Price Target 1: 1.17150 – Region of the 50 SMA on the Daily Price Chart.
- Price Target 2: 1.152 – In extension, the region of the upper trendline of the wedge pattern identified in the Weekly Forex Trading Tips report of 7th November.
- Stop Loss: > 1.2000 – Psychologically important round number price resistance.
Long positions
- Entry Level 1: 1.17150 – Buying into short-term weakness in the region of the 50 SMA on the Daily Price Chart.
- Price Target 1: 1.2000 – Psychologically important price level.
- Price Target 2: 1.22934 – In extension. Price high of 1st August 2022.
- Stop Loss: < 1.15856 – Region of the 100 SMA on the Daily Price Chart.
EURUSD
Euro traders have a quieter week in terms of news flow. The main economic report is due on Tuesday when the German ZEW index for November is released at 10 a.m. CET. That leaves the door open to technical analysis indicators to guide EURUSD as it plots the course of the breakout of its long-term downward trendline.
A return to the trendline resistance looks increasingly unlikely. The failed breakout, which occurred on 24th October, was followed by a return to that trendline, but as it then provided support on 3rd and 4th November, the door is now open to further upward price movement.
EURUSD Chart – Daily Candles – Confirmed Breakout
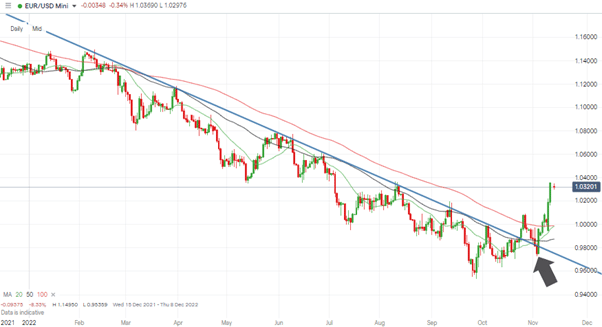
Source: IG
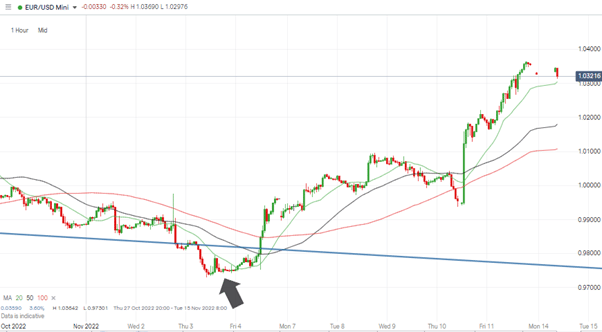
The 100 SMA on the Daily Price Chart is currently in the region of 0.99887. Being so close to the parity price level of 1.000 makes that region of the price chart a new key support level.
EURUSD Chart – Hourly Candles – 20 SMA
Source: IG
As with GBPUSD, the breakout has so far tracked the 20 SMA on the Hourly Price Chart. As a result of the burst of buying activity at the end of last week, that metric is now showing signs of being potentially overextended. The 20 SMA is sitting at 1.02987, whilst the 50 SMA and 100 SMA can be found at 1.01921 and 1.01110, respectively. Any price consolidation can be expected to bring those moving averages into play.
Short positions
- Entry Level 1: 1.02987 – Scalping strategy looking for short-term gains should the price break below the support offered by the 20 SMA on the Hourly Price Chart.
- Price Target 1: 1.01921 – Region of the 50 SMA on the Hourly Price Chart.
- Price Target 2: 1.01110 – Region of the 100 SMA on the Hourly Price Chart.
- Stop Loss: > 1.04000 – Round number price level.
Long positions
- Entry Level 1: 1.02000 – Psychologically important price level, also in the region of the 50 SMA on the Hourly Price Chart (1.01921).
- Price Target 1: 1.05885 – Region of the 50 SMA on the Weekly Price Chart and just above the round number 1.05 price level.
- Stop Loss: < 1.01988 – 23.8% Fib retracement level of the downward price move between 7th January and 27th September 2022
Indices
S&P 500
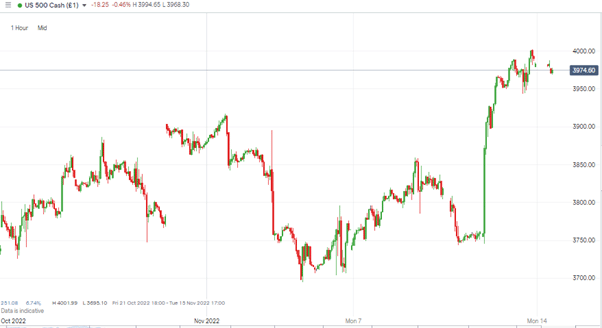
The rebound in the global stock markets has raised the possibility of a strong rally into the end of the year. Santa and his rally could have arrived early this year.
Triggered by the benign CPI data and a sense that stocks had been oversold, the week-on-week gain for the S&P 500 was 5.79%. With few resistance levels in sight, there could be upward momentum for the foreseeable future.
The coming week’s corporate announcements include Q3 updates from Walmart on Tuesday and Cisco, NVIDIA and Target on Wednesday. But November’s earnings season is drawing to a close, so attention will be returning to the macro factors such as inflation and interest rates.
S&P 500 Chart – Daily Candles – Widening Channel
Source: IG
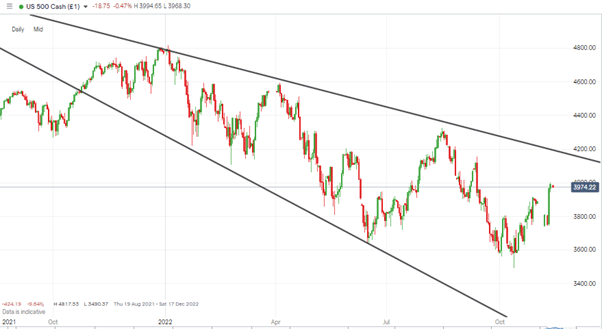
One cautionary note is that the price channel is widening rather than narrowing. That reflects how price volatility has increased throughout 2022, and a return to risk-aversion could see the S&P 500 test a supporting trendline with the potential to be as low as 3.081.
S&P 500 Chart – Hourly Candles
Source: IG
Short positions
- Entry Level 1: 4,000 – Psychologically important price level already acting as resistance to upward momentum.
- Price Target 1: 3,742 – Weekly price low printed on 7th November 2022.
- Price Target 2: 3,490 – Year to date price low printed on Thursday 13th October
- Stop Loss: >4,200 – Region of upper trendline of the multi-month downward price channel.
Long positions
- Entry Level 1: 3,921 – Buying into any weakness which takes price into the region of the 50 SMA on the Daily Price Chart
- Price Target 1: 3,913 – Psychologically important price level.
- Price Target 2: 4,200 – In extension, region of upper trendline of the multi-month downwards price channel.
- Stop Loss: < 3,490 – Year to date price low of Thursday 13th October.
Crypto – Bitcoin & Ethereum
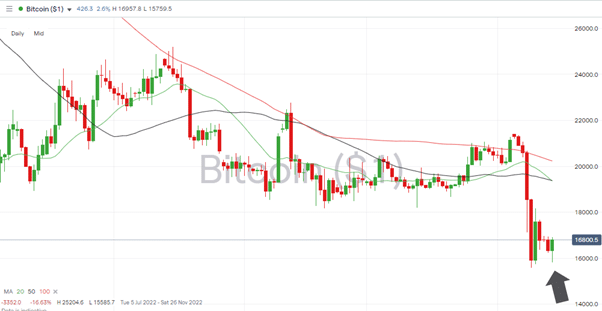
Concerns about the health of the entire crypto sector triggered a fire sale of coins. Bitcoin and Ethereum posted almost 20% falls in value thanks to crypto exchange FTX filing for bankruptcy.
Events at FTX are a reminder that the crypto markets and dedicated exchanges are unregulated. Those looking to buy the current dip may want to consider using a multi-asset broker rather than a dedicated exchange. However, cryptocurrency trades would still fall out of the scope of regulatory protection. But brokers that benefit from revenue streams from stock, forex and commodity trading have diversified their risk compared to firms which are 100% exposed to events in the crypto space.
Bitcoin Price Chart – Daily Candles
Source: IG
Bitcoin Long positions
- Entry Level 1: 16,000 – Round number price level, which has offered support following the collapse of FTX.
- Price Target 1: 19,383 – Region of the 20 and 50 SMAs on the Daily Price Chart.
- Price Target 2: 20,000 – In extension, psychologically important price level.
- Stop Losses: < 15,585 – Year to date price low printed on Wednesday 9th November.
Ethereum
Ethereum Chart – Daily Candles
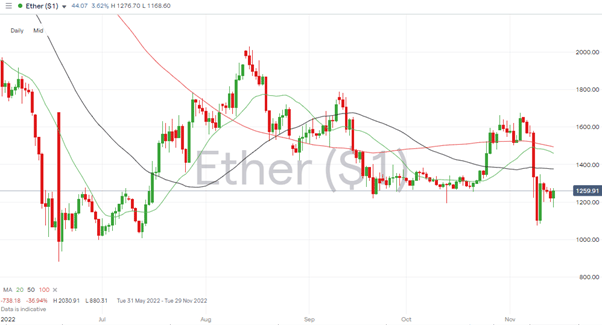
Source: IG
Ethereum Long positions
- Entry Level 1: 1,200 – Buying into any weakness which takes price to this round number price support level.
- Price Target 1: 1,376 – Region of the 50 SMA on the Daily Price Chart.
- Stop Losses: < 880.31 – Year to date price low printed on 18th June.
Risk Statement: Trading financial products carries a high risk to your capital, especially trading leverage products such as CFDs. They may not be suitable for everyone. Please make sure that you fully understand the risks. You should consider whether you can afford to take the risk of losing your money.

Forextraders' Broker of the Month
BlackBull Markets is a reliable and well-respected trading platform that provides its customers with high-quality access to a wide range of asset groups. The broker is headquartered in New Zealand which explains why it has flown under the radar for a few years but it is a great broker that is now building a global following. The BlackBull Markets site is intuitive and easy to use, making it an ideal choice for beginners.