
FOCUS ON: Markets Poised as They Approach Year End
- News flow is drying up in the run into the end of the year
- With prices poised to tilt either way, traders need to remain vigilant
- Bank of Japan looks most likely to cause a surprise
After a week of dramatic interest rate rises by major central banks, the coming week brings reports which are, to a greater extent, opaque but equally important. Consumer and business confidence data from the US, Germany, and the eurozone will offer insight into the global economy’s health as the markets run into the end of the year.
Markets come into the data released at critical pivot points. Forex and stock traders will be aware that at current levels, prices could move in either direction with some force. The last trading week of 2022 looks less like a ceremonial run-in to year-end numbers and more like the warm-up to what could be a tumultuous 2023.
The final trading sessions of 2022 will be conducted off the foundations laid by the US Fed, Bank of England and ECB, all raising interest rates last week. The moves were in-line with analyst forecasts, but the accompanying guidance was hawkish to the extent that it surprised some and caused a massive sell-off in risk-on assets, especially equities.
Major US benchmark stock indices gave up between 3-5% in value, and GBPUSD and USDJPY currency pairs moved to reflect a rush towards the relative security of the greenback.
The one anomaly to the change in risk appetite was the EURUSD currency pair which gained in value by 71 basis points. That was thanks to the ECB pre-warning investors that 2023 looks set to be a year of interest rate hikes, even if that triggers a deeper recession in eurozone countries.
US Dollar Basket Chart – Daily Candles – Consolidation Within Downwards Wedge
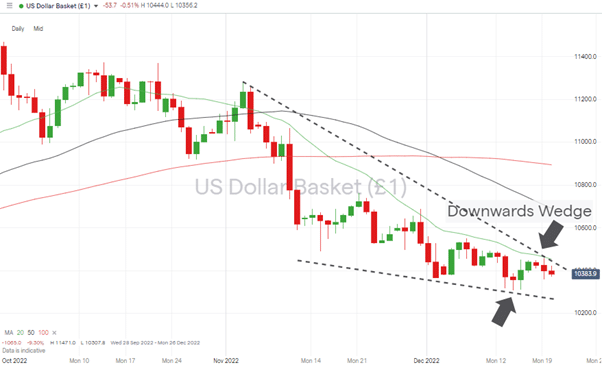
Source: IG
Also read: What is the USD Index?
The US Dollar Basket index (DXY) is still trading within its downward wedge pattern. While that holds, traders are left without confirmation of which way the next trend will head. The price consolidation since the start of December opens the door to a move in either direction. Still, with the RSI on the Daily Price Chart currently in the region of 37, there are few clues as to whether the market is over or undersold.
The trading calendar over the holidays highlights how exchanges may be closed or open half-day. There are enough major news events to ensure this might not be the snoozy run into the year-end it could be.
Instrument | Price | Hourly | Daily |
EUR/USD | 1.0613 | Strong Buy | Strong Buy |
GBP/USD | 1.2149 | Neutral | Neutral |
USD/JPY | 132.63 | Strong Sell | Strong Sell |
S&P 500 | 3,790 | Strong Sell | Strong Sell |
NASDAQ 100 | 10,989 | Strong Sell | Strong Sell |
FTSE100 | 7,310 | Strong Sell | Strong Sell |
Gold | 1,793 | Strong Buy | Strong Buy |
Crude Oil WTI | 75.19 | Strong Sell | Sell |
Bitcoin | 16,760 | Strong Buy | Strong Sell |
Ethereum | 1,205 | Strong Buy | Strong Sell |
UTC: 09:42
Our trading signal analysis is based on a comprehensive summary of market data. We use a range of metrics with weighting given to simple and exponential moving averages and key technical indicators.
We created this Weekly Tips section to share possible trade entry and exit points based on our technical analysis. We also have other methods to validate our trades which we can’t publicly share that help to increase their success. All our trades include entry and at least one target price. Stop losses are applied at the reader’s discretion. Our strategies typically trade with a wide stop loss, and risk is further mitigated by trading in small sizes.
Holiday Trading Calendar
Monday 19th Dec
- 9 am (GMT) – German IFO index (December): Analyst forecast is business climate index to rise to 87.
Tuesday 20th Dec
- 12.30 am (GMT) – RBA meeting minutes.
- 3 am (GMT) – Bank of Japan rate decision: Analyst forecast rates to remain at -0.1%.
- 3 pm (GMT) – eurozone consumer confidence (December): Analyst forecast is index to fall to -24.6.
Wednesday 21st Dec
- 7 am (GMT) – German GfK consumer confidence (January): Analyst forecast is index to rise to -36.
- 1.30 pm (GMT) – Canada CPI (November): Analyst forecast prices to rise 6.8% year on year and 0.4% month on month, from 6.9% and 0.7%, respectively.
- 3 pm (GMT) – US existing home sales (November), consumer confidence (December): Analyst forecast sales to fall 1.7% month on month and consumer confidence to drop to 100 from 100.2.
- 3.30 pm (GMT) – US EIA crude oil inventories (week ending 16 December): previous week saw stockpiles rise by 10.2m barrels.
Thursday 22nd Dec
- 1.30 pm (GMT) – US initial jobless claims (w/e 17 December), Chicago Fed National activity index (November).
- 11.30 pm (GMT) – Japan CPI (November): Analyst forecast is prices to rise 3.9% YoY from 3.7%.
Friday 23rd Dec
- Christmas Eve – half day for UK and US markets.
- 1.30 pm (GMT) – US durable goods orders (November): Analyst forecast is orders to rise 0.8% month on month.
- 3 pm (GMT) – US new home sales (November): Analyst forecast is sales to rise 3% month on month.
Monday 26th Dec
- Boxing Day – UK markets closed.
- 11.30 pm (GMT) – Japan unemployment rate (November): Analyst forecast is ‘unchanged’ rates to be held at 2.6%.
Tuesday 27th Dec
- UK bank holiday – UK markets closed.
- US markets open.
Wednesday 28th Dec
- 3 pm (GMT) – US pending home sales (November): sales fell 4.6% last month.
Thursday 29th Dec
- 1.30 pm (GMT) – US initial jobless claims (week ending 24 December).
- 4 pm (GMT) – US EIA crude oil inventories (week ending 23 December).
Friday 30th Dec
- 2.45 pm (GMT) – US Chicago PMI (December 2022): previous reading 37.2.
Forex
GBPUSD
The Bank of England’s decision on Thursday 15th December to raise UK interest rates to 3.5%, their highest level for 14 years, was followed by a slump in GBPUSD. It was the ninth consecutive rate rise, but once again, guidance from the Bank appeared to be less hawkish than that of the central bank’s US counterpart.
Forecasts for the UK economy are not as strong as those in the US, which makes Thursday 22nd December, a date to watch out for. That is when UK Q3 GDP will be confirmed, with most analysts expecting it to show that the UK economy contracted during that period.
GBPUSD Chart – Daily Candles – Reaction to BoE
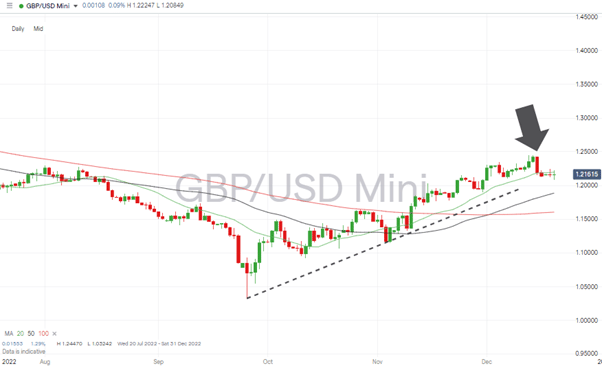
Source: IG
A negative GDP figure for Q3 would set the foundations for a technical recession being confirmed should the Q4 number (as expected) also show a contraction. The dilemma for the Bank is how to balance rising prices and slowing economic growth. Traders took the view that future UK rates might not be as high as anticipated.
The bull run in GBPUSD is challenged by that possible shift in fundamentals, and price has fallen to trade in line with, and then below, the 20 SMA on the Daily Price Chart.
GBPUSD Chart – Hourly Candles – 100 SMA
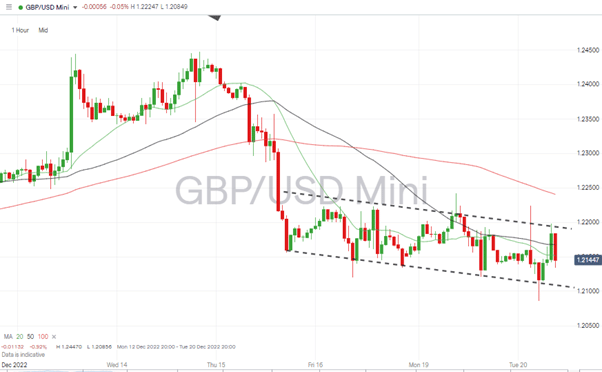
Source: IG
The RSI on the Hourly Price Charts is 50.7 leaving the option for a breakout to the upside or downside. The current price channel being slightly downward hints at a period of price consolidation being possible before the market determines which way the next trend will go.
Short positions
- Entry Level 1: 1.21967 – Region of the 20 SMA on the Daily Price Chart. Price has traded above this metric since 10th November, and the confirmed break of this support level over the last few trading sessions opens the door to further downward movement.
- Price Target 1: 1.2000 – Psychologically important price level.
- Price Target 2: 1.18863 – Region of 50 SMA on Daily Price Chart.
- Stop Loss: > 1.24470 – Price high of Wednesday 14th December.
Long positions
- Entry Level 1: 1.21967 – Applying a breakout strategy and buying into upward moves, which take price back above the 20 SMA on the Daily Price Chart.
- Price Target 1: 1.24000 – Round number price resistance.
- Price Target 2: 1.26497 – In extension, price high of 31st May 2022.
- Stop Loss: < 1.2000 – Round number support level.
EURUSD
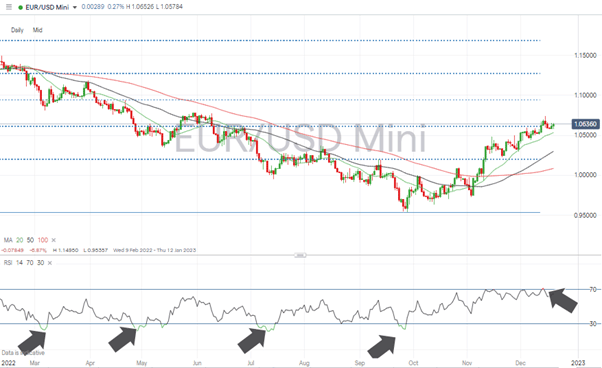
Last week, the euro’s outperformance of sterling and the yen has kept within its bullish price pattern. There is stiff resistance it needs to break through if its upward trajectory is to continue. A retracement can’t be discounted, but the path of least resistance continues to be upward.
EURUSD has, unlike GBPUSD, managed to continue trading above the 20 SMA on the Daily Price Chart. The recent period of price consolidation coincided with the RSI on the Daily Price Chart, breaching the overbought reading of 70, which occurred on 13th December.
EURUSD Chart – Daily Candles – Price Consolidation and RSI
Source: IG
The break through the psychologically important 1.06 price level was a significant move, but the 38.2% Fib retracement of the price fall from January 2021 to September 2022 sits at 1.061. That has slowed the euro’s progress and continues to drag on the currency pair despite EURUSD trading at 1.0635 when markets opened on Tuesday.
While price continues to hold above the Fib retracement and Daily 20 SMA, the current sideways trading can be considered bullish consolidation.
EURUSD Chart – Hourly Candles
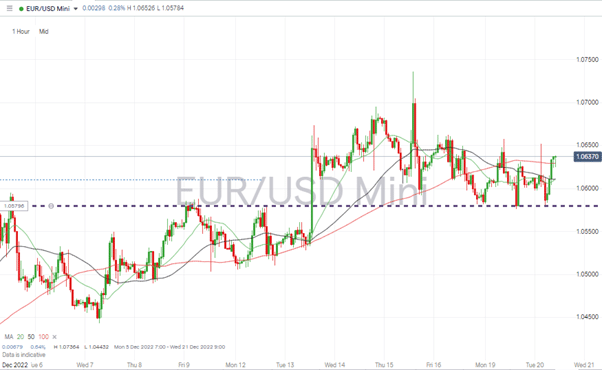
Source: IG
The Hourly Price Chart shows the importance of the 1.05796 price level. This acted as resistance on Friday 9th and Monday 12th December but turned into support during the start of the present week.
The low-key prospects of the eurozone economy suggest a rampant breakout to the upside might not materialise; however, trading off that support level offers a chance to go long EURUSD with relatively tight stop-losses in place.
Short positions
- Entry Level 1: 1.05796 – Applying a breakout strategy based on price weakening after a breach of the support level.
- Price Target 1: 1.05343 – Region of 20 SMA on Daily Price Chart.
- Price Target 2: 1.0400 – Psychologically important round number support level, which acted as resistance between 15th and 30th November.
- Stop Loss: > 1.061 – Using the 38.2% Fib retracement level of the downward price move between 7th January and 27th September 2022. Also, area of the price high of 1.0615 of 27th June 2022.
Long positions
- Entry Level 1: 1.05796 – Buying into weakness which takes price to the region of the resistance/support price level on the Hourly Price Chart.
- Price Target 1: 1.0774 – Price high of 9th June 2022.
- Stop Loss: < 1.05343 – Region of 20 SMA on Daily Price Chart.
USDJPY
The Bank of Japan will announce its latest interest rate policy on 20th January. While most analysts forecast that headline interest rates will remain unchanged, press reports over the weekend suggest there could be surprises in store.
Potential new policies focus on the Japanese bond market. The suggestion is that Japan’s government could work in conjunction with the BoJ to manipulate bond yields with maturity dates of under ten years.
That would represent a significant policy change and have ramifications for various asset groups. USDJPY would be the most directly impacted, but the role the yen plays with investors, as the currency of choice to borrow to finance buying other assets, means any move along those lines could represent a paradigm shift.
USDJPY Price Chart – Daily Candles
Source: IG
Increased intervention by Japanese authorities can’t be guaranteed, but the Hourly Price Chart does point to limited scope for upward price moves. Should a shift in policy come about, considerable price weakness can be expected, suggesting traders should adopt policies with a bias to the short side.
USDJPY Price Chart – Hourly Candles
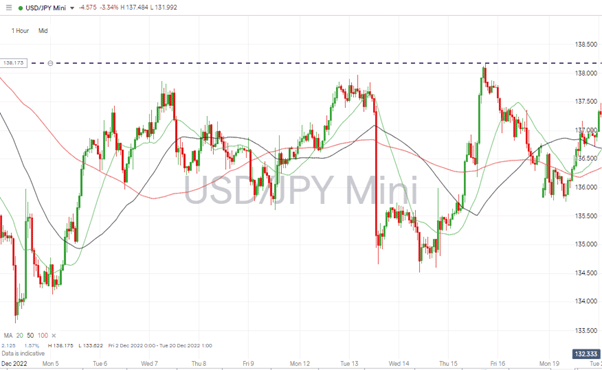
Source: IG
Short positions
- Entry Level 1: 138.00 – Selling into price strength using the round number price level of 138, which sits just below the 138.17 price high of Thursday 15th December.
- Price Target 1: 135.75 – Intra-week price low of Monday 19th December.
- Price Target 2: 134.51 – Price low of 14th December.
- Stop Loss: > 140.00 – Psychologically important round number price level.
Indices
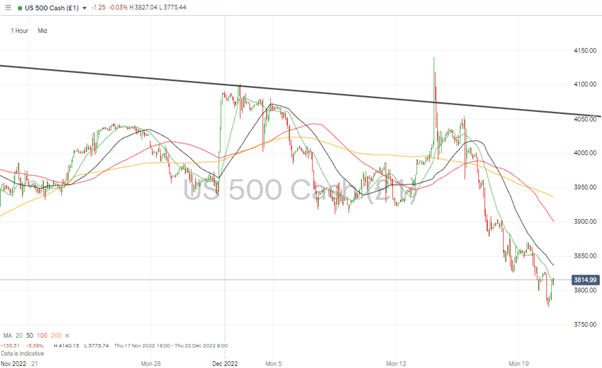
S&P 500
The hawkish guidance offered by Jerome Powell at Wednesday’s meeting of the FOMC resulted in an exodus from stocks. That dashed hopes that the positive CPI inflation news from the week before signalled the Fed interpreted inflation as being beaten.
The move by the S&P, up to as high as 4140 on Tuesday 13th December, hinted at the world’s flagship stock index posting a breakout of 2022’s downward price channel. But the rapid slide to 3812 has taken price back within that downward trading range and below the key SMAs on the Daily Price Chart.
S&P 500 Chart – Daily Candles – Return to Trading Channel
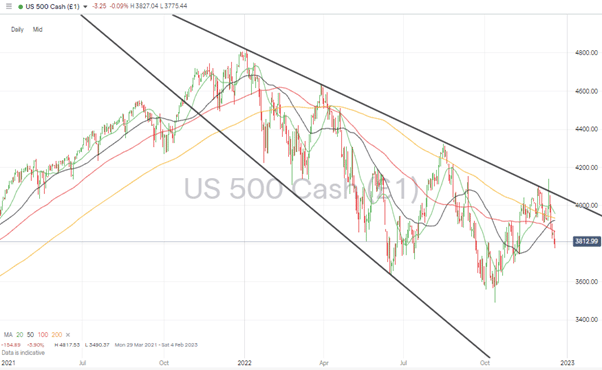
Source: IG
Price action on the Hourly Price Chart can only be described as bearish. Since the Fed’s interest rate announcement, the 20 SMA has strongly resisted any potential upward price move. Until that situation changes, the short-term prognosis for US stocks is further weakness.
S&P 500 Chart – Hourly Candles
Source: IG
Short positions
- Entry Level 1: 3,815 – Region of the 20 SMA on the Hourly Price Chart. Tracking that metric until price breaks through.
- Price Target 1: 3,657 – Region of 200 SMA on the Weekly Price Chart.
- Stop Loss: > 4,000 – Above round-number resistance.
Long positions
- Entry Level 1: 3,815– Region of the 20 SMA on the Hourly Price Chart. Buying into upward momentum if price breaks through that metric which has acted as resistance since Wednesday 14th December.
- Price Target 1: 3,900 – Region of the 50 SMA on the Hourly Price Chart and round number resistance.
- Price Target 2: 3,957 – Region of the 20 SMA on the Daily Price Chart and price resistance/support level held between 14th November and 15th December.
- Stop Loss: < 3,657 – Region of 200 SMA on the Weekly Price Chart.
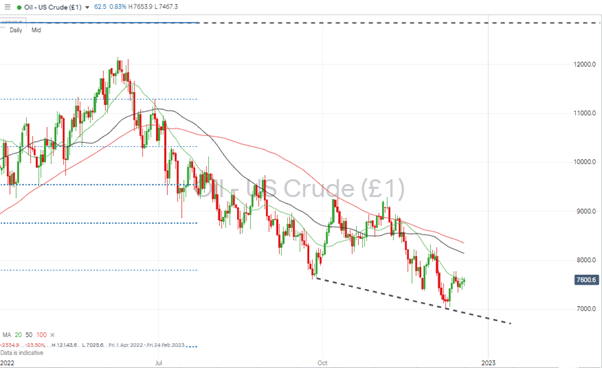
Oil – WTI
A short-term drop in oil price volatility has left crude prices sliding to as low as $70 per barrel. Long-term forecasts from many analysts point to the price rallying to above $100 per barrel in 2023. Still, with the broader economic outlook being so downbeat further price falls can’t be discounted.
OIL WTI Price Chart – Daily Candles
Source: IG
With WTI crude tracking the 20 SMA on the Daily Price Chart, further price consolidation looks like the most likely outcome until OPEC next meets.
Oil WTI Price Chart – Hourly Candles
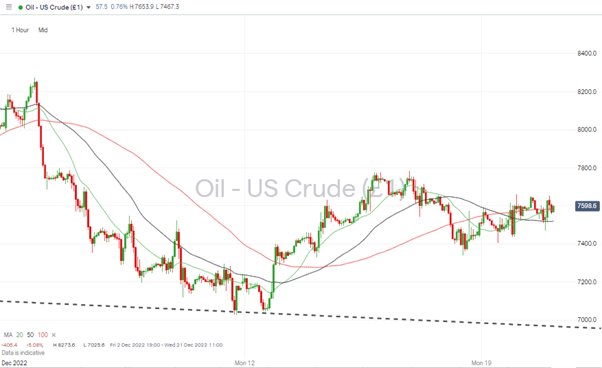
Source: IG
Short positions
- Entry Level 1: 76.20 – Selling into price strength which takes price as high as the 20 SMA on the Daily Price Chart
- Price Target 1: 70.00 – Round number price support.
- Price Target 2: 69.14 – Region of the supporting trend line of the price channel dating from 27th September.
- Stop Loss: > 77.82 – Price high of Thursday 15th December.
Long positions
- Entry Level 1: 70.25 – Year to date price low printed on 9th December 2022. September.
- Price Target 1: 76.20 – Region of the 20 SMA on the Daily Price Chart.
- Stop Loss: < 69.14 – Buying into weakness which takes price to the region of the supporting trend line of the price channel dating from 27th September.
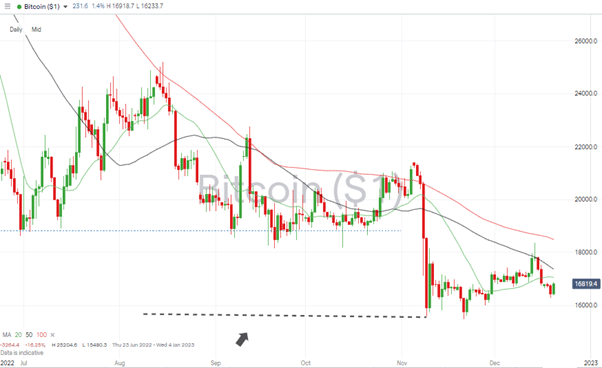
Crypto – Bitcoin & Ethereum
In a relatively quiet week for cryptos, Bitcoin and Ethereum posted returns smaller than those of stock indices and major currency pairs. Bitcoin’s week-on-week price change of -0.72% exemplifies the sector looks set to continue trading sideways until the next catalyst appears.
The price of Bitcoin (16,772) has been overtaken by the 20 SMA on the Daily Price Chart, which now sits at 17,078. That now acts as resistance to upward price moves and means the major support level is the year-to-date low of 15,480 recorded on Monday 21st November.
Bitcoin Price Chart – Daily Candles – Trading Below 20 SMA
Source: IG
Bitcoin Long positions
- Entry Level 1: 17,078 – Buying into a price move which breaks through the 20 SMA on the Daily Price Chart.
- Price Target 1: 18,493 – Region of the 100 SMA on the Daily Price Chart.
- Price Target 2: 20,000 – In extension, psychologically important price level.
- Stop Losses: < 15,480 – Year to date price low printed on Monday 21st November.
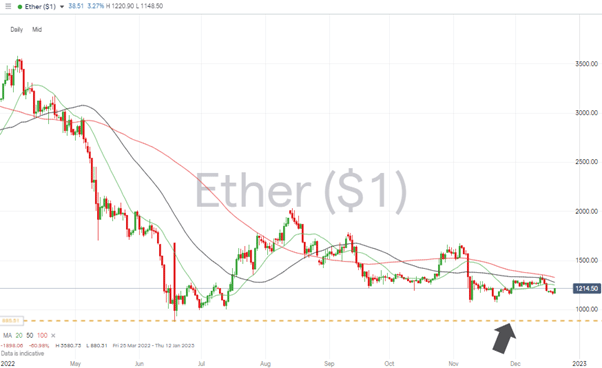
Ethereum
Ethereum Chart – Daily Candles – Trading below 20 SMA
Source: IG
Ethereum Long positions
- Entry Level 1: 1,252 – Applying a breakout strategy and using the 20 SMA on the Daily Price Chart as a guide for buying into upwards price momentum.
- Price Target 1: 1,328 – Region of the 100 SMA on the Daily Price Chart.
- Price Target 2: 1,676 – Price high of 4th November 2022.
- Stop Losses: < 880.31 – Year to date price low printed on 18th June.
Risk Statement: Trading financial products carries a high risk to your capital, especially trading leverage products such as CFDs. They may not be suitable for everyone. Please make sure that you fully understand the risks. You should consider whether you can afford to take the risk of losing your money.

Forextraders' Broker of the Month
BlackBull Markets is a reliable and well-respected trading platform that provides its customers with high-quality access to a wide range of asset groups. The broker is headquartered in New Zealand which explains why it has flown under the radar for a few years but it is a great broker that is now building a global following. The BlackBull Markets site is intuitive and easy to use, making it an ideal choice for beginners.