
FOCUS ON: Quiet Newsweek Brings Key Technical Indicators into Play
- Central bank interest rate decisions dampen market mood
- Week ahead is quiet in terms of news flow
- Key technical levels look set to guide price
Trading Ideas
We created this Weekly Tips section to share possible trade entry and exit points based on our technical analysis. We also have other methods to validate our trades which we can’t publicly share that help to increase their success. All our trades include entry and at least one target price. Stop losses are applied at the reader’s discretion. Our strategies typically trade with a wide stop loss, and risk is further mitigated by trading in small sizes.
Instrument | Price | Hourly | Daily |
GBP/USD | 1.2245 | Strong Sell | Strong Sell |
EUR/USD | 1.0645 | Strong Sell | Strong Sell |
USD/JPY | 148.42 | Strong Buy | Strong Buy |
S&P 500 | 4,335 | Strong Sell | Strong Sell |
NASDAQ 100 | 14,768 | Strong Sell | Strong Buy |
FTSE100 | 7,668 | Strong Buy | Strong Buy |
Gold | 1,924 | Strong Sell | Strong Sell |
Crude Oil WTI | 89.97 | Strong Buy | Strong Buy |
Bitcoin | 26,101 | Strong Sell | Strong Sell |
Ethereum | 1,576 | Strong Sell | Strong Sell |
UTC: 09:22
US Dollar Basket Index (DXY)
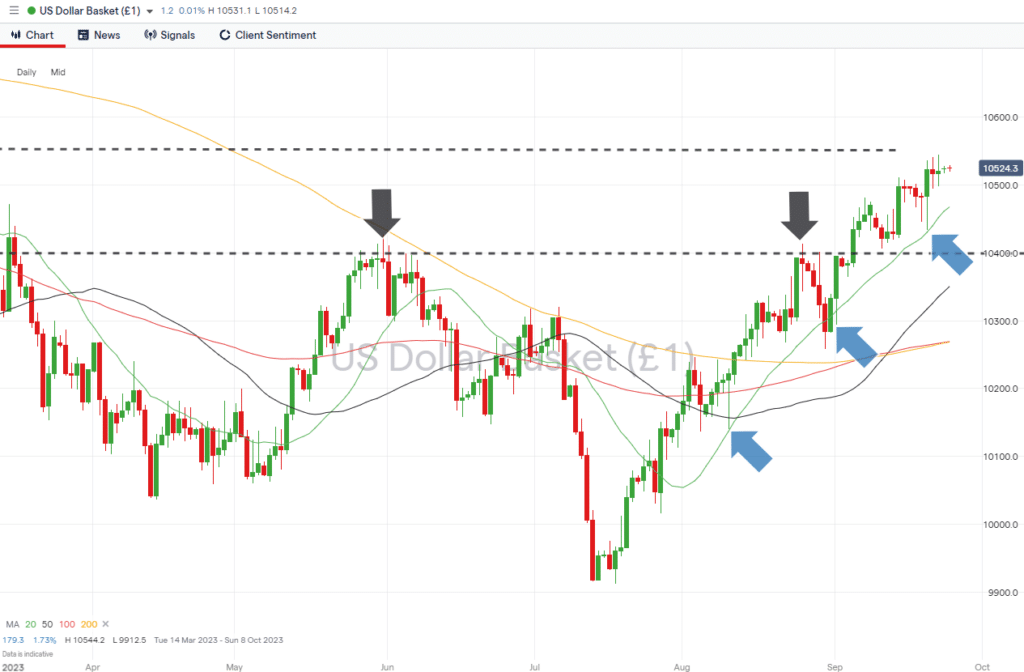
The collection of central bank announcements made last week left investors of risk-on assets somewhat nervous. The headline decision by the US Federal Reserve on Wednesday was to leave US interest rates unchanged; however, there was enough hawkish sentiment expressed in the post-decision press conference to trigger a run to the perceived security of the US dollar.
US Dollar Basket Chart – Daily Price Chart
Source: IG
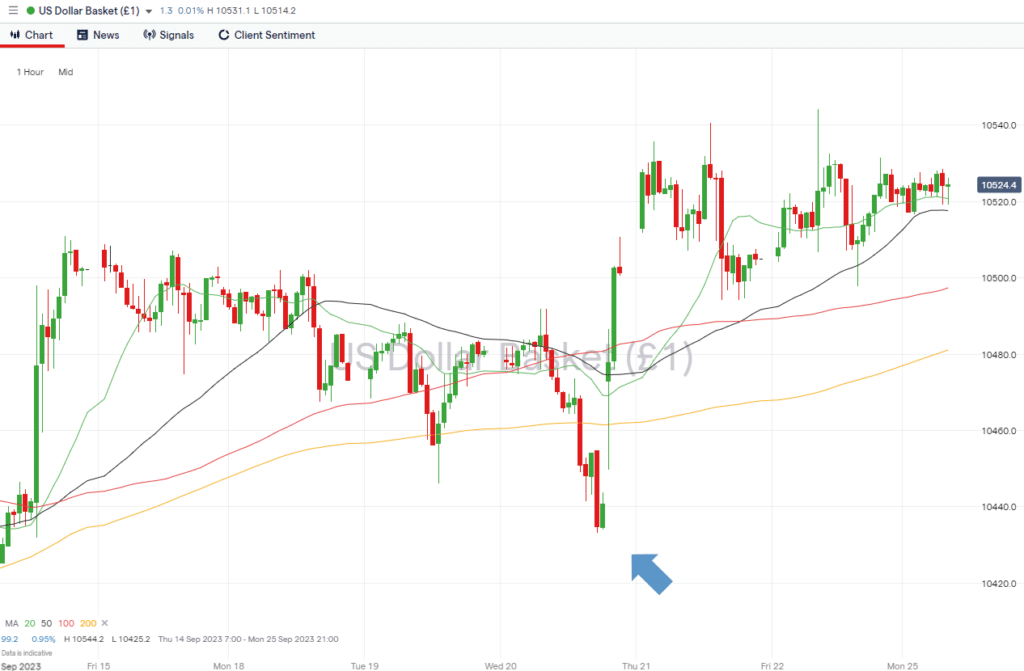
US Dollar Basket Chart – Hourly Price Chart
Source: IG
Short positions
- Entry Level 1: 105.51 – The year-to-date price high of 8th March is now firmly in play. Resistance and opportunities to sell USD can be expected at this price level.
- Price Target 1: 104.60 – Region of the 20 SMA (Simple Moving Average) on the Daily Price Chart.
- Price Target 2: 103.94 – In extension, price level of double top pattern formed by the peaks of June and August.
- Stop Loss: > 105.51 – Tight stop-loss as few resistance points above trade entry point.
Long positions
- Entry Level 1: 104.60 – The blue arrows on the Daily Price Chart indicate how the 20 SMA has guided the recent upward price move. Those looking to join the trend could apply a degree of patience and enter into positions at the time of a pullback.
- Price Target 1: 105.51 – Year-to-date price high printed on 8th March.
- Stop Loss: < 104.33 – Intraday price low of 20th September, which forms a swing-low price pattern.
GBPUSD
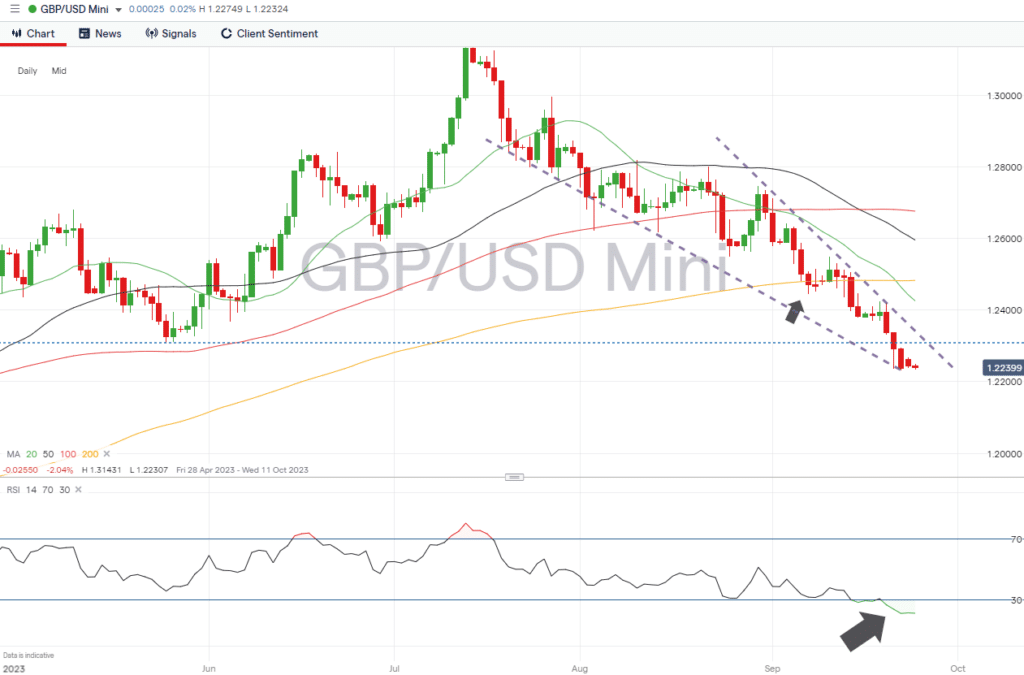
The decision by the Bank of England to leave interest rates unchanged, resisting a further rate hike, resulted in GBPUSD continuing its downward trend. With the RSI on the Daily Price Chart generating a reading of <22, there is room for bottom-fishers to step into an oversold market.
Daily Price Chart – GBPUSD Chart – Daily Price Chart
Source: IG
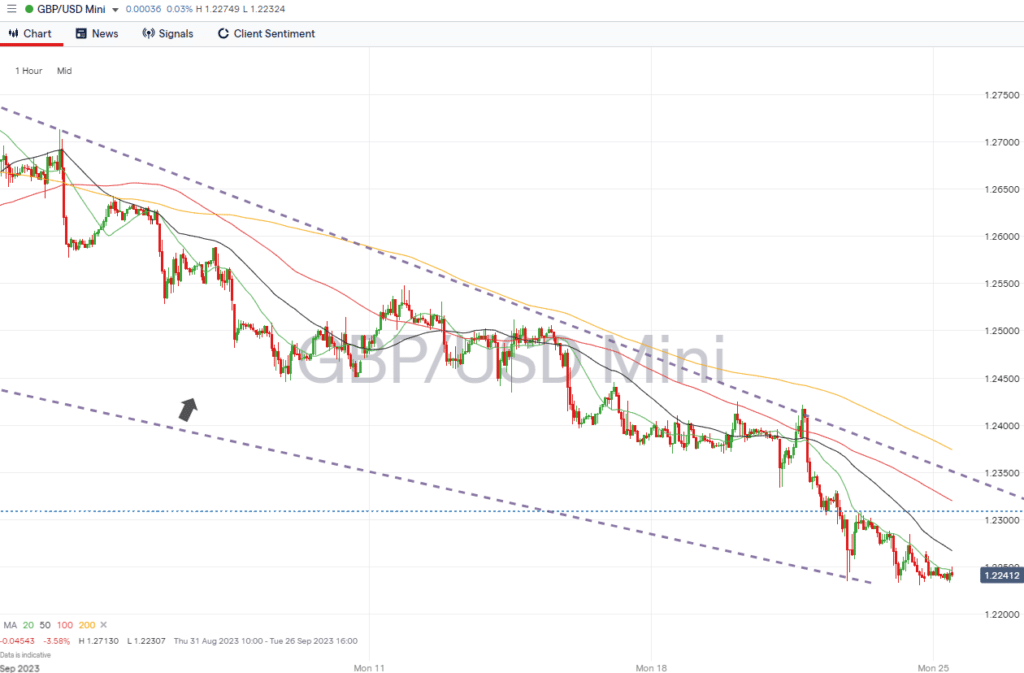
GBPUSD Chart – Hourly Price Chart
Source: IG
Short positions
- Entry Level 1: 1.23111 – Swing low price support/resistance level formed on 26th May.
- Price Target 1: 1.22307 – Intraday price low of 22nd September.
- Price Target 2: 1.2000 – In extension, psychologically important ‘round number’ price level.
- Stop Loss: > 1.23462 – Region of the upper band of the downward trendline.
Long positions
- Entry Level 1: 1.22307 – Intraday low of 22nd September, which marks lower band of downward price channel.
- Price Target 1: 1.23111 – Swing low price support/resistance level of 26th May and region of upper band of downward trendline.
- Price Target 2: 1.24256 – In extension, region of the 20 SMA on the Daily Price Chart.
- Stop Loss: > 1.22307 – Tight stop-loss as few resistance points below trade entry point.
EURUSD
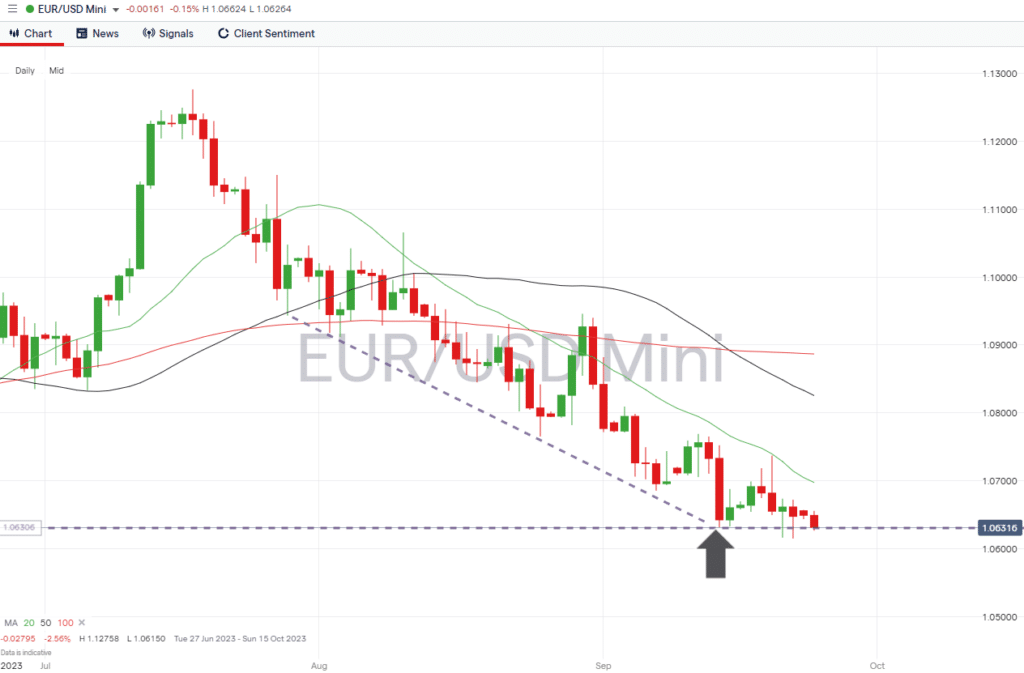
The decision taken by the ECB at its last meeting to raise interest rates marks a point where Eurozone interest rate policy has diverged from those of the US and UK. That has resulted in price consolidating at a key support level, which could indicate a trend reversal.
EURUSD Chart – Daily Price Chart
Source: IG
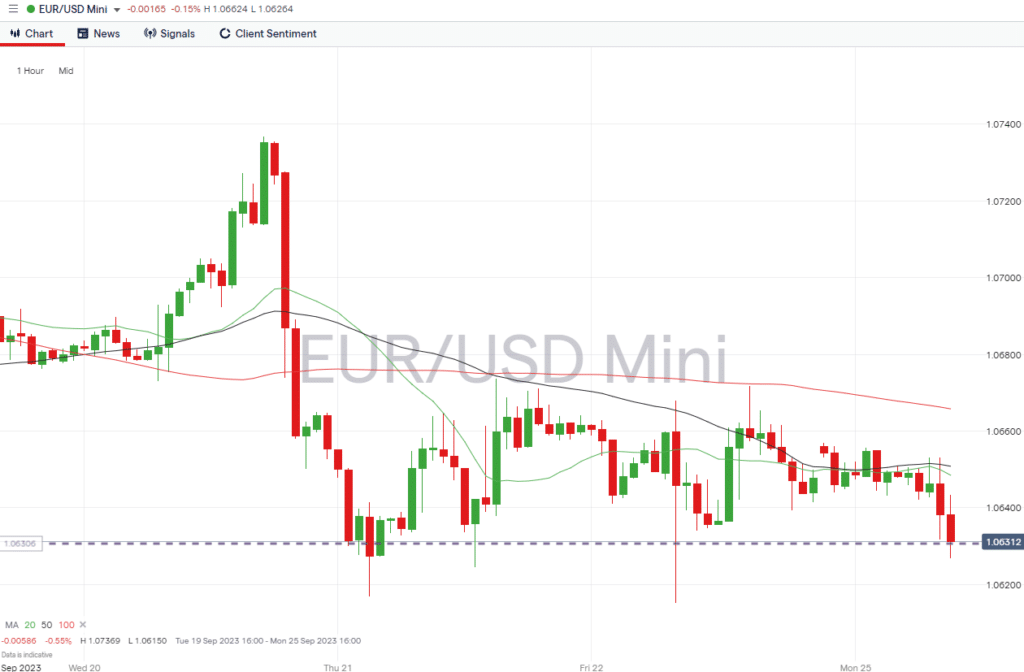
EURUSD Chart – Hourly Price Chart
Source: IG
Short positions
- Entry Level 1: 1.06319 – A break to below the price low of 14th September would open the door to further downward momentum.
- Price Target 1: 1.05163 – Area of support formed by intraday price moves on 24th February, 8th and 15th March.
- Stop Loss: > 1.0700 – Round number resistance level and region of the 20 SMA on the Daily Price Chart.
Long positions
- Entry Level 1: 1.06319 – A bounce off the support offered by the price low of 14th September would open the door to a trend reversal.
- Price Target 1: 1.06974 – Region of the 20 SMA on the Daily Price Chart.
- Price Target 2: 1.07369 – Intraday price high of 20th September, which met with resistance provided by the 20 SMA on the Daily Price Chart.
- Price Target 3: 1.08254 – In extension, region of the 50 SMA on the Daily Price Chart.
- Stop Loss: < 1.06150 – Tight stop-loss as few resistance points below trade entry point.
Indices
S&P 500
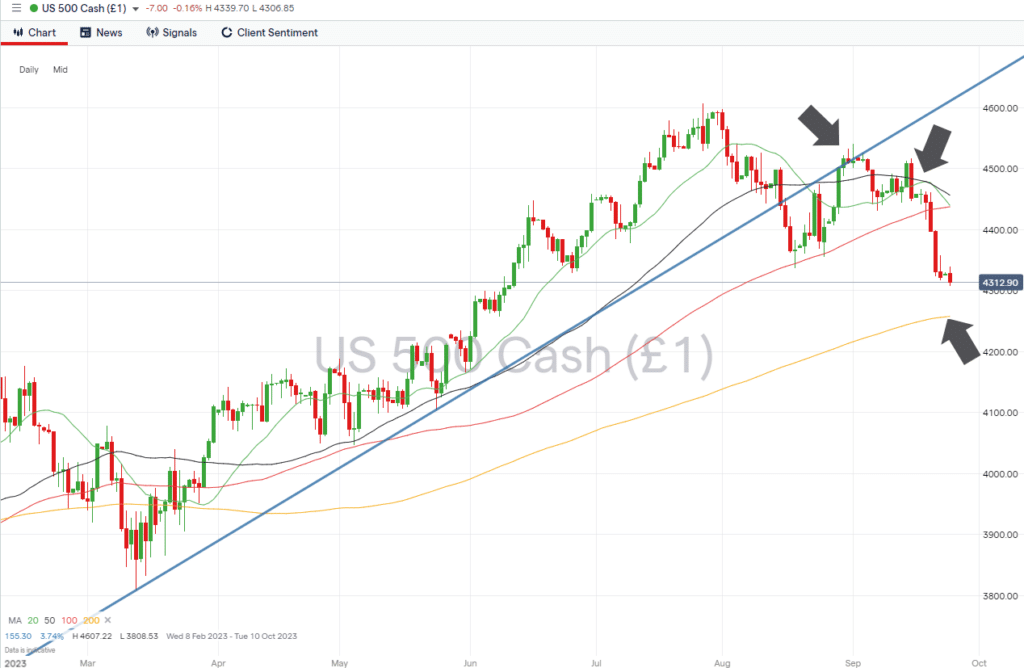
The break of the upward trend line, which dates back to September 2022, has been followed by stocks going into freefall. The RSI on the Daily Price Chart is currently <30, which leaves room for a bounce of some sort, with the question being whether bulls have the appetite for an extended rally.
S&P 500 Chart – Daily Price Chart
Source: IG
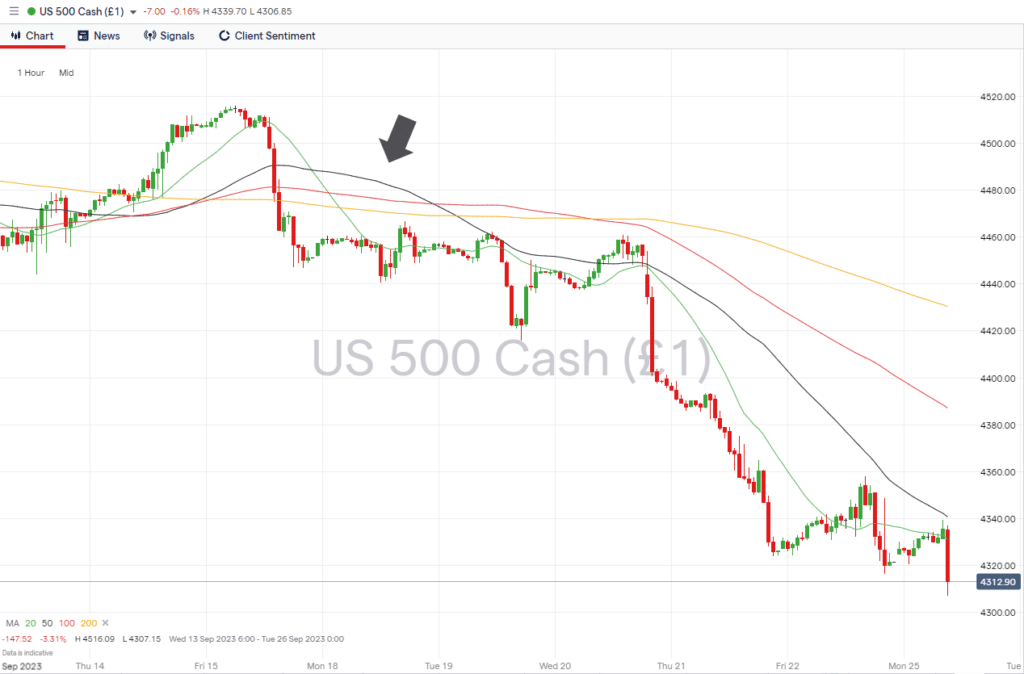
S&P 500 – Hourly Price Chart
Source: IG
Short positions
- Entry Level 1: 4,257 – A break of the 200 SMA on the Daily Price Chart would be a strong signal that further downward price movement is likely.
- Price Target 1: 4,046 – Swing low price pattern formed on 4th May.
- Price Target 1: 3,937 – Price low of 13th March, where price bounced off the long-term upward trendline.
- Stop Loss: > 4,435 – Point at which the 20, 50, and 100 SMAs on the Daily Price Chart are converging.
Long positions
- Entry Level 1: 4,257 – There is potential for the 200 SMA on the Daily Price Chart to act as a magnet for price, but with the Daily RSI currently reading 29.59, if or when that occurs, the market will be showing signs of being oversold.
- Price Target 1: 4,435 – Region of the convergence of the 20, 50 and 100 SMAs on the Daily Price Chart.
- Stop Loss: > 4,257 – Tight stop-loss as few resistance points below trade entry point.
Crypto – Bitcoin & Ethereum
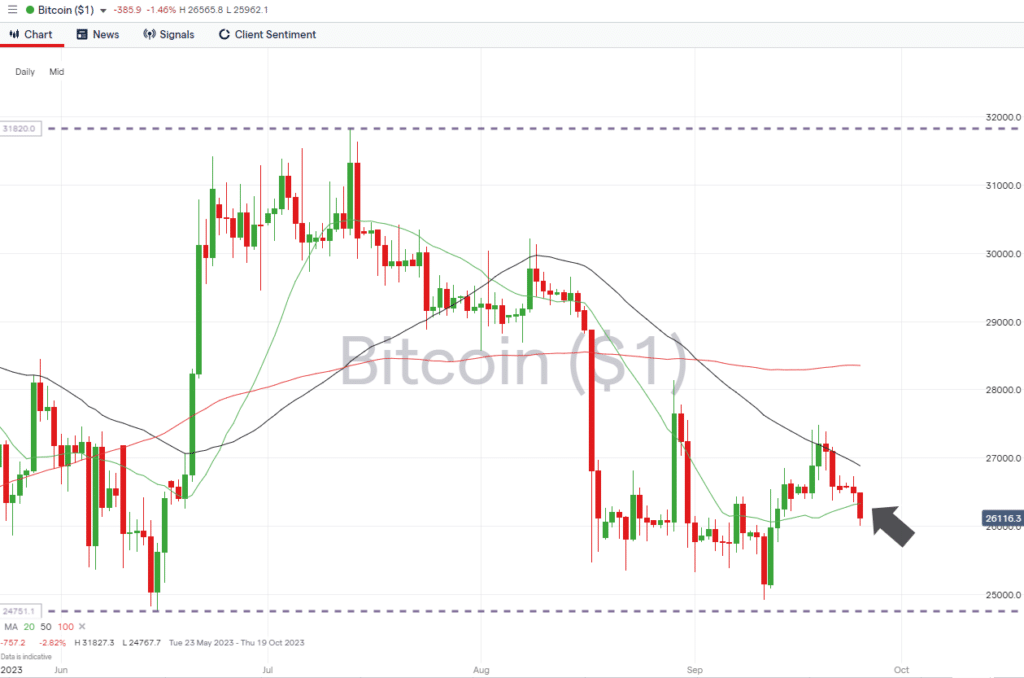
Both Bitcoin and Ethereum gave up over 2% in value last week. From a technical analysis perspective, the more significant event is that ETH and BTC are trading below their 20 SMAs on the Daily Price Chart. Those averages have acted as support over recent weeks.
Bitcoin Price Chart – Daily Price Chart
Source: IG
Bitcoin Long positions
- Entry Level 1: 26,334 – A retest and an upward break through the 20 SMA on the Daily Price Chart would signal that bullish momentum was returning to the market.
- Price Target 1: 26,886 – Region of the 50 SMA on the Daily Price Chart.
- Price Target 2: 31,827 – In extension, current year-to-date price high printed on 13th July.
- Stop Losses: < 25,334 – Support level provided by the price low printed on 1st September.
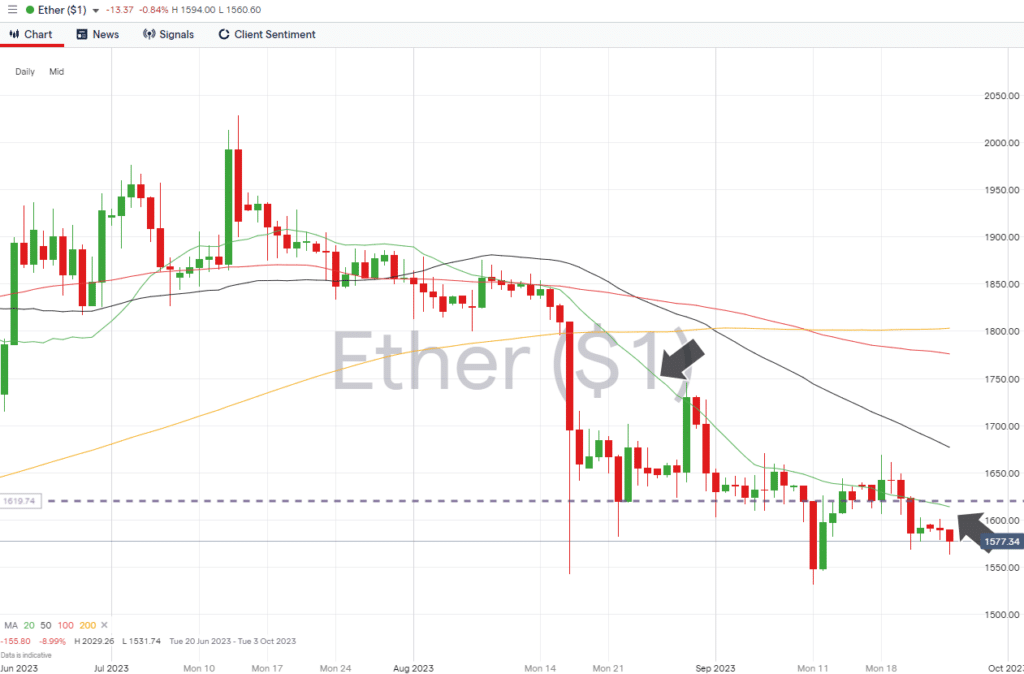
Ethereum
Ethereum Chart – Daily Price Chart
Source: IG
Ethereum Long positions
- Entry Level 1: 1,613 – Region of the 20 SMA on the Daily Price Chart. A confirmed break of this metric would be a bullish signal for traders and investors.
- Price Target 1: 1,676 – Region of the 50 SMA on the Daily Price Chart.
- Price Target 2: 2,000 – In extension, round number price level that previously acted as resistance on 13th and 14th July.
- Stop Losses: < 1,542 – Intraday price low recorded on 17th August.
Risk Statement: Trading financial products carries a high risk to your capital, especially trading leverage products such as CFDs. They may not be suitable for everyone. Please make sure that you fully understand the risks. You should consider whether you can afford to take the risk of losing your money.

Forextraders' Broker of the Month
BlackBull Markets is a reliable and well-respected trading platform that provides its customers with high-quality access to a wide range of asset groups. The broker is headquartered in New Zealand which explains why it has flown under the radar for a few years but it is a great broker that is now building a global following. The BlackBull Markets site is intuitive and easy to use, making it an ideal choice for beginners.