In this article, we will take a look at various forex scalping patterns that can either benefit traders who prefer calmer markets or those who prefer to be more active during breakouts when trading economic news events, for example.
Scalping the markets is a very common and popular trading style among technical traders who seek to profit from small and quick price movements on a regular basis.
There are many different strategies that can be used to scalp the markets, but the majority of scalping strategies include technical patterns to help traders make better-informed trading decisions.
Scalping With Chart Patterns
Chart patterns are formations that tend to repeat on a regular basis on any timeframe and market. Technical traders use patterns to help them determine when and where they should enter their positions, and the likely direction that price might move toward according to where a pattern forms.
One of the most common scalping chart patterns is the flag pattern, which is considered a trend continuation pattern that forms during a brief pause within a trend.
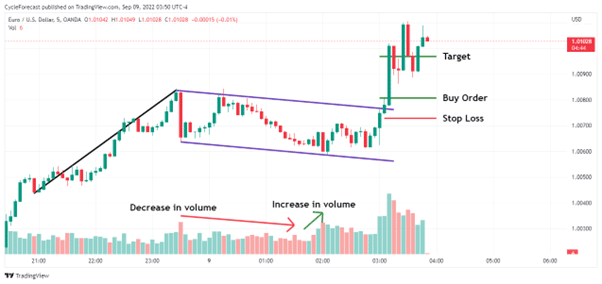
Image for illustration purposes only
The chart example above shows a bullish flag pattern that formed during an uptrend. There are two main parts that create the shape of a flag pattern: the pole part and the flag part.
The pole part on the image above is depicted by the black line and was drawn upward from a low point to a point before the flag part started.
The flag part of the pattern consists of two parallel lines (purple lines) that were drawn by connecting the highs and the lows during the corrective phase. Both parts of the flag pattern therefore resemble the shape of a flag on a pole, hence the name of the pattern.
When the flag pattern forms during an uptrend, as in the example above, traders would expect a bullish trend continuation at some stage and look for a buying opportunity. Flag patterns tend to display certain characteristics while they are underway, which can help traders determine when a flag pattern has likely ended before they prepare themselves to enter a trade.
One such characteristic is how volume tends to decrease during the formation of the flag part and how volume tends to pick up before price breaks out of the upper trendline of the flag. When this behaviour in volume occurs, it is often a good indication that you are dealing with a high-probability setup that could lead to a strong continuation of the trend.
Note how volume started to decrease during the formation of the flag but picked up again just before price broke out of the upper part of the pattern.
Scalpers will often look for additional confirmation from indicators such as the volume indicator and also wait for price to break out of the flag to signal that the pattern has completed.
Once price has broken and closed above the upper part of the flag pattern, scalpers may then proceed to place a buy order a few pips above the candlestick that closed above the upper trendline.
A stop loss can be placed a few pips below the breakout candle and a target order at a level that offers a 2:1 risk-reward ratio.
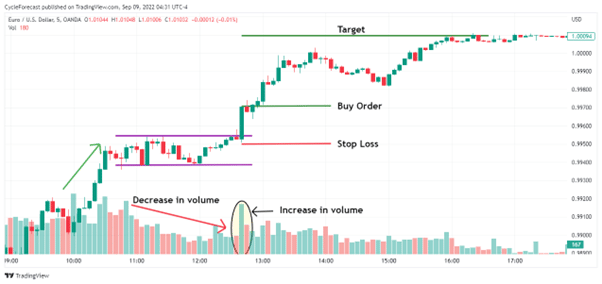
Image for illustration purposes only
Another common chart pattern is the range pattern, which is also a good candidate for scalping chart patterns.
The chart image above shows a period where price entered a range (purple horizontal lines) before a strong breakout occurred and the bullish trend resumed. With this example, the volume behaved the same as with our previous flag pattern example. First, there was a notable decrease in volume as price traded in a small range but a significant increase in volume during the breakout to the upside.
Entering a position after a range pattern works the same as with our previous example. A scalper may decide to place a buy order a few pips above the breakout candle and a stop loss below the same candlestick, while again targeting a level that offers a 2:1 risk-reward ratio.
Scalping With Candlestick Patterns
Scalping candlestick patterns also offers great trading opportunities as they are used by technical traders to forecast potential short-term price direction. There are many candlestick patterns in the world of trading, but the best ones to look out for include dojis, the morning star, and engulfing candlestick patterns (to name a few).
These candlestick patterns generally forecast a resumption of a trend after a corrective phase, which makes them good candidates for scalpers.
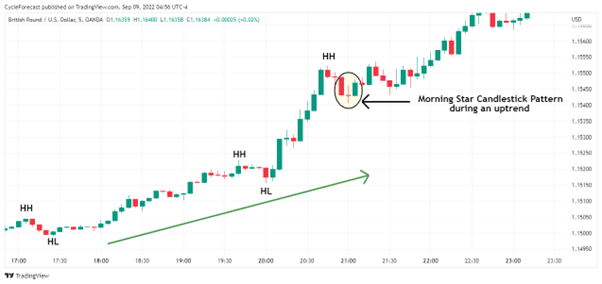
Image for illustration purposes only
The chart image above shows a morning star candlestick pattern (indicated by the oval) that formed after a brief correction during a strong uptrend. With this example, the currency pair created a sequence of higher highs (labelled HH) and higher lows (labelled HL), which indicated that this market was in an uptrend.
After a brief decline, a morning star candlestick pattern formed, which signalled that price was getting ready to potentially move higher again.
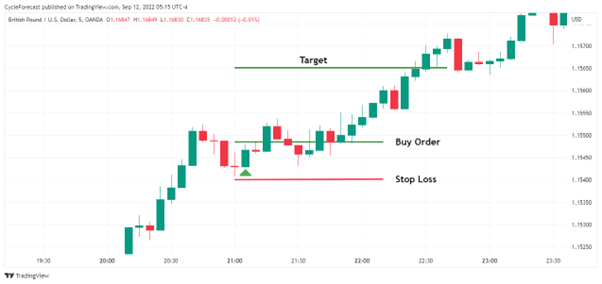
Image for illustration purposes only
Scalpers who follow this pattern will wait for the close of the third green candlestick (marked with the green arrow) and typically place a buy order a few pips above the same candle. A stop-loss order can be positioned a few pips below the lowest point of the entire pattern and a target order at a level that offers a 2:1 risk-reward ratio.
Scalping With Breakout Patterns
Breakout patterns simply refer to instances where price breaks out of an established pattern or reacts to an economic news event.
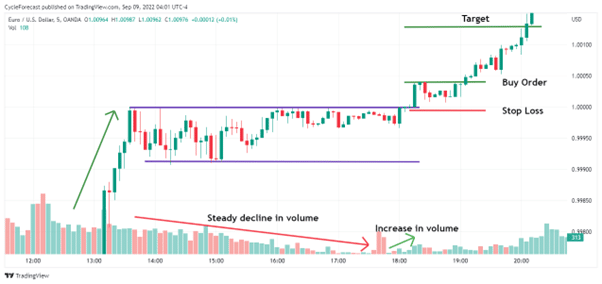
Image for illustration purposes only
The chart image above shows a clearly defined range in the EUR/USD before an important interest rate decision. This specific news event led to a strong breakout to the upside, which offered a great scalping opportunity.
With this example, volume increased at the same moment that the news event occurred and price broke above the upper area of the trading range.
Following the same order placement instructions as before, a scalper may have placed a buy order a few pips above the breakout candle and a stop loss a few pips below the same candlestick. The target order in this example was again positioned at a level that offered a 2:1 risk-reward ratio.
Note that trading news events can be very volatile and might not suit every trader’s risk tolerance. However, on the other hand, when a market breaks out of an established pattern during a news release, the resulting price move can be massive.
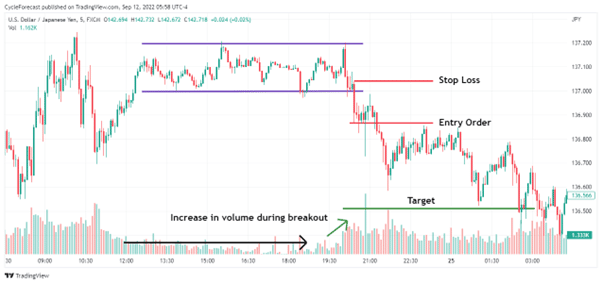
Image for illustration purposes only
Our final chart image above shows an example of where a breakout to the downside occurred after an established range. These types of breakouts are also referred to as technical breakouts because there was no obvious news catalyst at the time.
Technical breakouts can often be difficult to predict because there may be very little clarity as to what caused a sudden breakout. However, regardless of whether it was caused by some unknown news event or not, the volume indicator can yet again be used to help trade the pattern.
With the trade example above, volume remained relatively low during the formation of the range but clearly picked up slightly before and during the breakout (green arrow).
Trading this currency pair to the downside, a scalper may have placed a sell order a few pips below the breakout candle and positioned a stop loss a few pips above the same candle. The target was yet again placed at a level that offered a 2:1 risk-reward ratio.
Conclusion
Forex scalping patterns offer great trading opportunities especially for active traders who prefer to hold positions for short periods of time.
In this article, we introduced various forex scalping patterns and explained how to trade them following an easy strategy. We also used the volume indicator to assist with spotting the best pattern setups.
Don’t Trade Before you see this!
We consulted our team of experts and put together 10 tips to help improve your trading.
These tips could help make you a better trader – and we’re giving them away for free!
Related Articles

Forextraders' Broker of the Month
BlackBull Markets is a reliable and well-respected trading platform that provides its customers with high-quality access to a wide range of asset groups. The broker is headquartered in New Zealand which explains why it has flown under the radar for a few years but it is a great broker that is now building a global following. The BlackBull Markets site is intuitive and easy to use, making it an ideal choice for beginners.