

Scalping is a very attractive style of trading for many forex traders. Most novice traders have likely heard of this method at some point or have even tried it for themselves. Many will have realised that this style of trading is not easy and requires a lot of patience and discipline. Considering the small profits that scalpers aim for by executing multiple trades a day, the margin for error is very small and requires a proven scalping strategy. Successful scalping strategies require consistently high win rates and impeccable timing, and it is essential that one single loss does not wipe out all your hard-earned profits. This article will discuss some simple forex scalping strategies based on popular indicators traders use to find high probability setups to scalp on the 1-, 5- and 15-minute timeframes.
1-Minute Forex Scalping Strategy
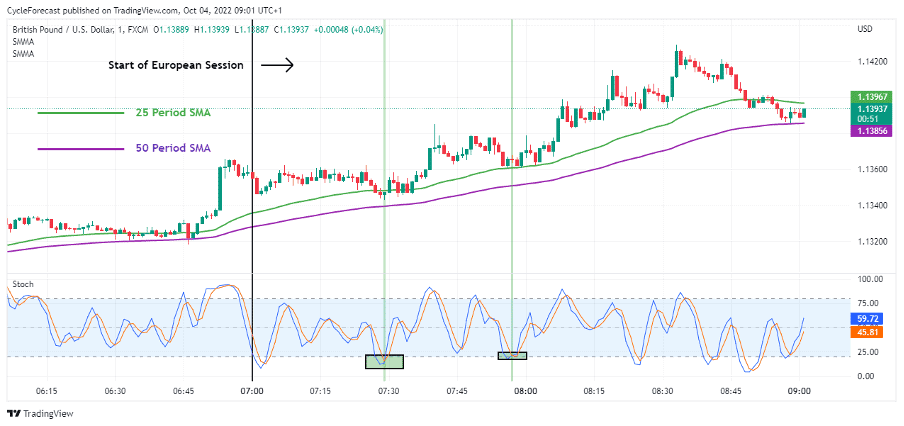
The 1-minute timeframe is generally the smallest timeframe traders use to scalp the forex market. The strategy below uses a combination of two different indicators to identify potential trade setups and signal when a trade should be taken.
Source: TradingView
To implement this scalping strategy, you would need to set up your chart as follows:
- Select a forex pair that is most active during a particular trading session and has a tight spread.
- Open a chart using the 1-minute timeframe.
- Apply a Stochastic Oscillator indicator using settings of 5, 3, 3.
- Apply two Simple Moving Average (SMA) indicators with different periods of 25 and 50.
Using the major forex pairs with the 1-minute timeframe is crucial because they have the smallest spreads and are, therefore, best suited for most scalping strategies. Remember that the spread is similar to the cost of opening a position, so the smaller the spread, the less it will affect your profit potential.
Scalping on a timeframe this small, traders will often target moves between 8–12 pips per trade with tight stop losses.
Our chart example above used the GBP/USD, a highly liquid forex pair but even more so during the European session that runs from 7 a.m. to 4 p.m. GMT
The Stochastic Oscillator indicator was used to spot overbought and oversold market conditions that occur when the Stochastic lines cross above the horizontal 80 level and below the horizontal 20 level.
Now that the 1-minute forex scalping strategy chart has been set up, you should be ready to start looking for entry signals.
Buy signals occur as follows:
- The 25-period SMA (green line) must be above the 50-period SMA (purple line) – signifying an uptrend.
- Wait for price to pull back toward the 25 or 50-period SMA lines, and the Stochastic Oscillator lines need to be below the horizontal 20 level (oversold market condition).
- Once the above conditions are met, enter a long position as soon as the Stochastic Oscillator lines cross above the horizontal 20-level line.
The green vertical lines on the chart image above show the buy signals that presented themselves when all the right indicator conditions were in place.
To minimize your risk, a stop loss can be placed 2-3 pips below the most recent swing low, and a target order can be placed at a level that offers between 8-12 pips of profit per trade.
Source: TradingView
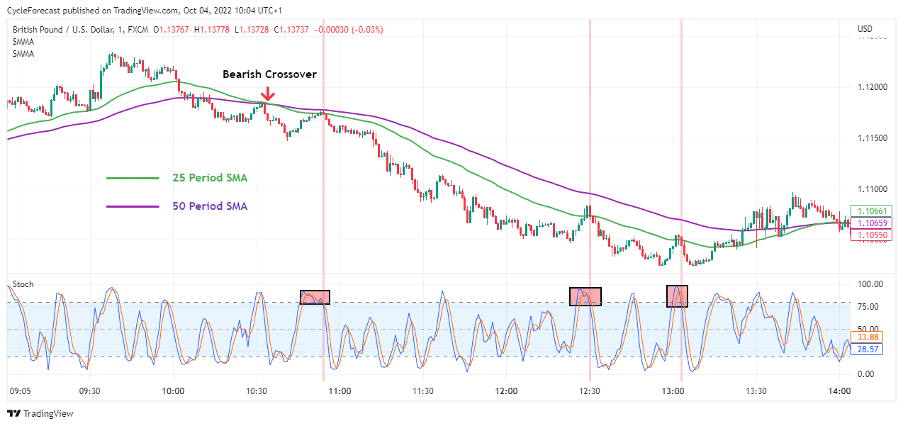
Sell signals occur when the exact opposite indicator conditions appear using the same indicators discussed above. With this example, the GBP/USD experienced a downtrend on the 1-minute timeframe during the European session when the 25-period SMA crossed below the 50-period SMA.
Each time that price pulled back to the 25 period SMA and the Stochastic Oscillator went into an overbought state, short entry signals (indicated by the red vertical lines) presented themselves when the Stochastic Oscillator crossed below the horizontal 80 level.
5 Minute Forex Scalping Strategy
The 5-minute timeframe is another common timeframe used for forex scalping strategies, and the strategy presented below makes use of a different indicator that is also suited for scalping.
Source: TradingView
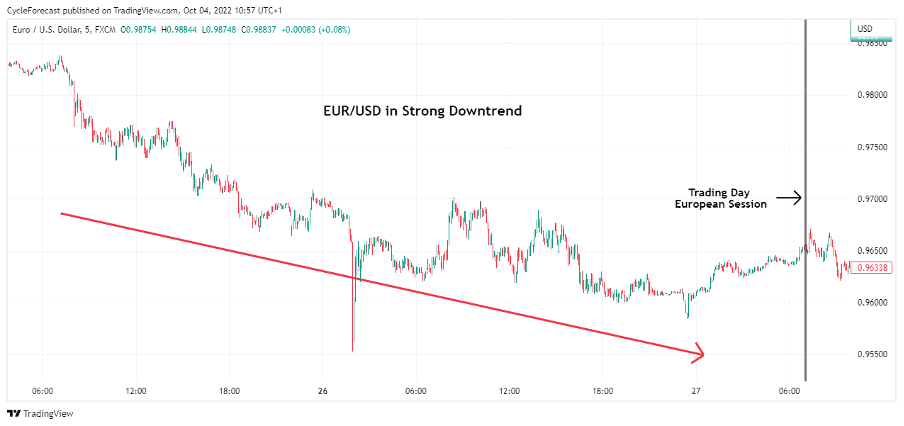
This 5-minute forex scalping strategy relies on Bollinger Bands to generate trading signals. Before we look at the trade setups, it is important to note that this strategy works best when trades are taken in the same direction as the main trend.
The chart example above shows the EUR/USD set to a 5-minute timeframe and that this major forex pair was trading in a clear downtrend prior to the European session.
Knowing that the trend was bearish meant that only sell setups were to be taken using the Bollinger Band indicator.
Source: TradingView
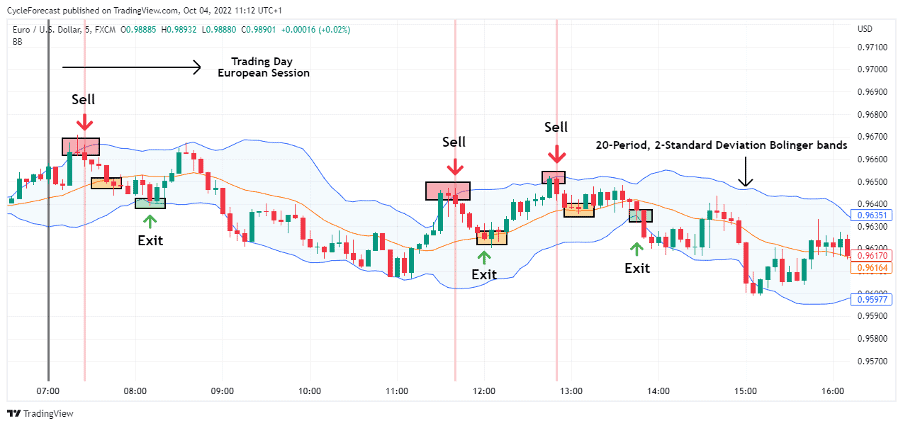
Our next chart shows the Bollinger bands indicator using the 20-period, 2-standard deviation settings on the day the European session commenced. The upper and lower blue lines are the Bollinger bands, and the orange line that runs in the middle is a simple moving average that, by default, forms part of the indicator.
Bollinger bands expand during trending phases and contract during consolidation phases. Price also tends to revert to the simple moving average, or the opposite side of the Bollinger bands, after either side of the Bollinger bands is reached or breached.
This reversion in price behaviour at the extreme ends of the Bollinger bands is what traders look for when using this indicator to scalp the forex market.
Since the main trend was bearish before the trading session, a sell signal will occur as follows:
- Wait for a candlestick to close above the upper 2-standard deviation Bollinger band.
- Wait for a bearish candlestick to cross back below the upper Bollinger band.
As soon as a bearish 5-minute candlestick closes below the upper Bollinger band, a short entry can be taken with a stop loss 2-3 pips above the most recent swing high.
With this simple strategy, a trader can decide to exit their position as soon as price hits the middle simple moving average line (marked with small orange boxes) or when it reaches the lower Bollinger band.
What is important to note here is that a scalper should calculate the distance from the intended entry level to the middle line, or lower Bollinger band, before an entry is taken. This is to ensure that the target levels have a favourable risk vs reward ratio. Some setups might not offer enough distance toward these lines to make the risk vs reward potential worth it.
15-Minute Forex Scalping Strategy
The 15-minute timeframe is generally not as popular as the 1 or 2-minute timeframes but can still provide many scalping opportunities, although less often compared to the smaller timeframes.
Source: TradingView
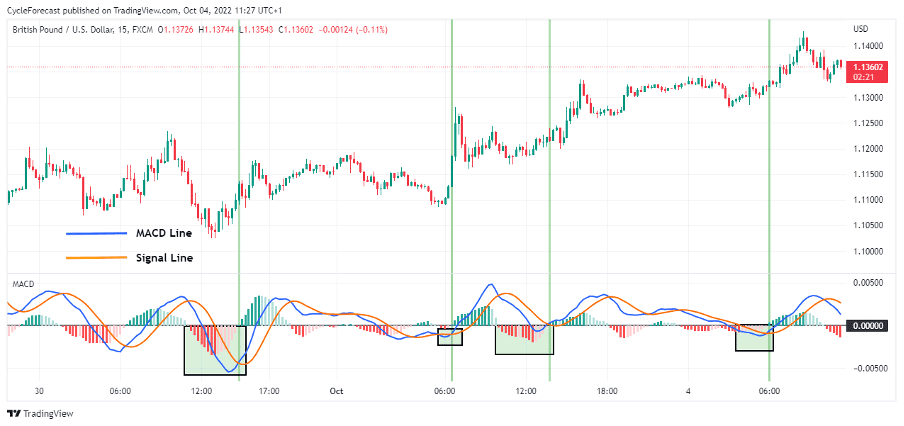
Our final 15-minute scalping strategy example uses the Moving Average Convergence Divergence indicator (MACD) to derive entry signals.
The MACD is a momentum oscillator indicator that helps traders identify trend direction and whether the bullish or bearish momentum in the price is strengthening or weakening.
There are three main components that the MACD indicator consists of:
- The MACD line (coloured blue)
- The signal line (coloured orange)
- The histogram (green and red bars plotted above and below a centre zero line)
For this strategy, the MACD indicator inputs should be set to 12 (fast length) and 26 (slow length), with a signal smoothing setting of 9.
Each time the blue MACD line crosses below the orange signal line, the histogram plots bars below the centre line and vice versa.
There will naturally be pullbacks during a trending phase, as with the bullish trend depicted on the chart above. Note how the histogram turned red each time a pullback occurred, but as soon as the MACD line crossed above the signal line (and the histogram turned green), the uptrend resumed.
Related Articles
- Forex Scalping Using Signals
- The Best Forex Indicators for Scalping
- Chart Patterns Scalping Strategy
This is why the MACD is a useful indicator and is perfect for scalping strategies.
Since this major forex pair was trending higher, buy signals occurred each time the MACD line crossed above the signal line – as indicated by the green boxes and vertical lines.
With this strategy, scalp trading on a 15-minute timeframe will generally require larger stop losses because of the higher timeframe.
As a guide, a stop loss can be placed below a recent swing low, while a target can be placed at a level that offers a 2-to-1 risk vs reward ratio.
Other Technical Indicators
Apart from the indicators we used for the scalping strategies above, there are other helpful scalping indicators worth mentioning, like the Exponential Moving Average (EMA), Parabolic SAR, and the Relative Strength Index (RSI) indicators.
Some of these indicators may work well on their own or could be used in combination to formulate a scalping strategy.
Don’t Trade Before you see this!
We consulted our team of experts and put together 10 tips to help improve your trading.
These tips could help make you a better trader – and we’re giving them away for free!
The Best Forex Brokers for Scalping
| Broker | Features | Regulator | Platforms | Next Step | |
|---|---|---|---|---|---|
 Your capital is at risk
Founded: 2014 Your capital is at risk
Founded: 2014 |
|
FSPR | MT4 | ||
 Your capital is at risk
Founded: 2006 Your capital is at risk
Founded: 2006Europe* CFDs ar... |
|
ASIC, FSA, FSB, MiFID | MetaTrader4, Sirix, AvaOptions, AvaTrader, Mirror Trader | ||
 Between 74-89% of CFD traders lose
Founded: 2010 Between 74-89% of CFD traders lose
Founded: 2010Between 74-89 % of retail investor accounts lose money when trading CFDs |
|
ASIC, FCA | MetaTrader 4, MetaTrader 5, cTrader | ||
 Your capital is at risk
Founded: 2009, 2015, 2017 Your capital is at risk
Founded: 2009, 2015, 2017 |
|
ASIC, CySEC, IFSC | MT4 Terminal, MT4 for Mac, Web Trader, iPhone/iPad Trader, Droid Trader, Mobile Trader, MT5 | ||
 Your capital is at risk
Founded: 2006 Your capital is at risk
Founded: 2006 |
|
CySEC, DFSA, FCA, FSB, SIA | MetaTrader4, MetaTrader5, cTrader, FxPro Edge (Beta) | ||
 Your capital is at risk
Founded: 2011 Your capital is at risk
Founded: 2011 |
|
CySEC, FSC, FSCA, MISA | MT4, MT5, OctaTrader | ||
Here, we have introduced simple yet effective scalping strategies using the most popular scalping timeframes and indicators.
There are many scalping strategies out there. Some may be more complex than others, but they were all designed to identify the best trading opportunities and gain an edge in this fast-paced and competitive world of online trading.
Forextraders' Broker of the Month
BlackBull Markets is a reliable and well-respected trading platform that provides its customers with high-quality access to a wide range of asset groups. The broker is headquartered in New Zealand which explains why it has flown under the radar for a few years but it is a great broker that is now building a global following. The BlackBull Markets site is intuitive and easy to use, making it an ideal choice for beginners.
