
In this article, we will discuss some of the best forex indicators for scalping and how they can be used to formulate a scalping strategy.
Scalping the forex market is one of the most popular trading styles amongst active traders that seek to profit from small and fast price movements. However, tis action-packed trading style can be very challenging and requires laser-sharp focus, a strict exit strategy to limit risk, and a lot of discipline to succeed.
Since scalpers attempt to profit from small price movements, it is crucial that they avoid situations where one large loss can wipe out all their profits. To avoid this, successful scalpers rely on multiple factors, such as scalping indicators, a live data feed, and fast execution speeds to make their strategy profitable. The possibility of a loss of capital is a factor to remain constantly aware of here.
Simple Moving Average
The Simple Moving Average Indicator (SMA) calculates the average of a selected range of prices, usually closing prices, by the number of periods in that range. This indicator is particularly useful in determining whether a market is in a bullish or bearish trend and when a trend might reverse.
Source: TradingView
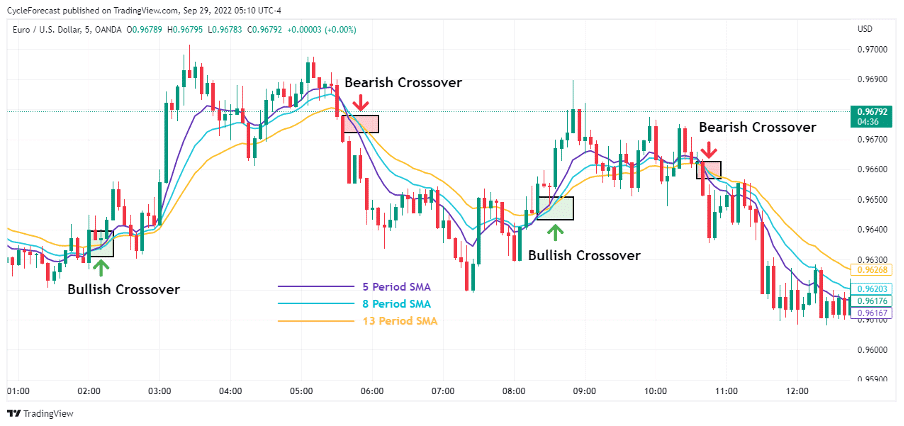
The chart example above shows three Simple Moving Averages with periods of 5, 8 and 13 applied to a 5-minute timeframe of the EUR/USD forex pair.
An SMA with a shorter period, like the purple 5-period SMA line, for example, will be quicker to respond to changes in price direction, whereas an SMA with a period of 13 will take longer to respond to a change in price direction.
A bullish crossover occurs at the point where the 5, 8, and 13 period SMAs align to the upside, which signals the start of a potential bullish trend. The opposite is true when a bearish crossover occurs at the point where the 5, 8, and 13 SMAs line up below each other and start pointing downwards.
Scalpers will often use three SMAs with different periods, like the ones shown above, to identify when a bullish or bearish trend has started. This is to ensure that they trade with the trend and to time their entries and exits better.
Source: TradingView
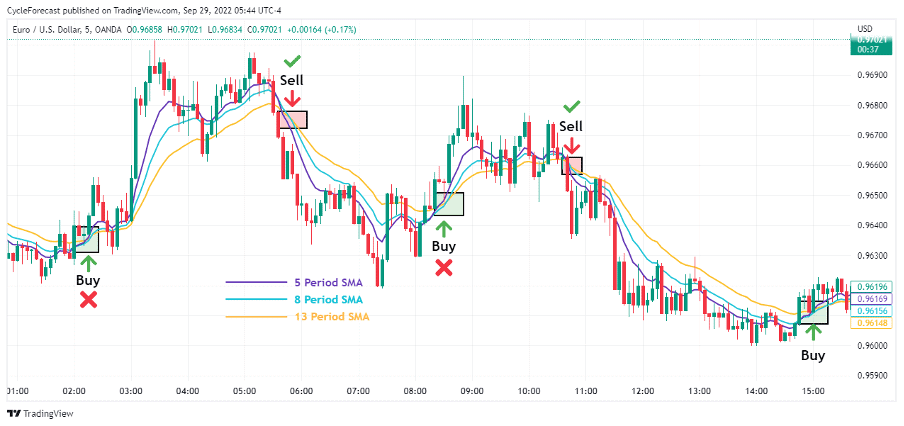
Scalping entries can be taken whenever the three SMA’s cross and align to the upside or downside, as shown by the buy and sell points using the same chart as before. To exit a trade, scalpers can use this SMA crossover strategy to exit their position whenever the SMA lines cross in the opposite direction.
Although this simple entry and exit strategy sounds easy, not all buy and sell signals should necessarily be taken. Note that although the first buy signal (on the far left) would have resulted in a profitable trade, that the second buy signal would have resulted in a loss.
With the example above, the sell signals would have been the preferred entries that should have been taken while avoiding all the buy setups. The reason for choosing only the sell setups was clearly evident by paying close attention to what the main trend was on a higher timeframe.
Source: TradingView
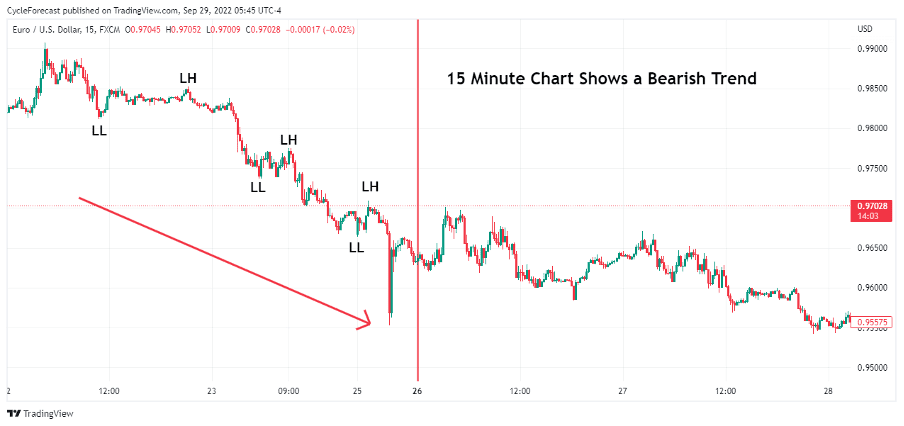
With most strategies, traders will often want to see what the main trend of a market is on a higher timeframe. Doing this will often help them to stay on the ‘right’ side of the trend and avoid them from trading against the trend.
Using a larger timeframe, like the 15-minute of the same EUR/USD forex pair, it is clear to see that price was making lower lows (labelled LL) and lower highs (labelled LH) leading into the date (red vertical line) from where the image of our 5-minute chart example was taken.
Knowing that the trend was bearish prior to the entry signals that were shown by the three SMAs on the 5-minute chart would have allowed scalpers to only look for selling opportunities.
Bollinger Bands
One of the most well known and popular forex indicators for scalping are Bollinger Bands. Bollinger Bands are drawn above and below a price’s simple moving average at a specific standard deviation level. These bands almost act like a rubber band that can be stretched but then snap back when the tension is released.
In trading terms, these bands expand when volatility picks up and contract again during periods when volatility has died down.
Source: TradingView
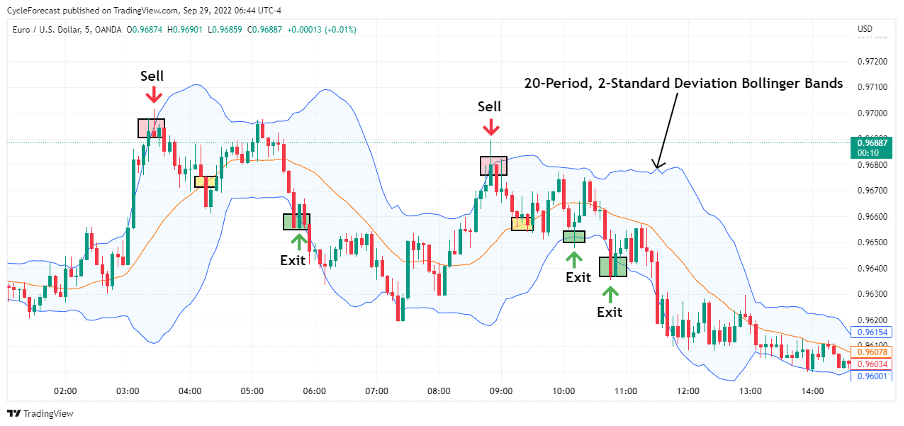
The chart image above shows the Bollinger bands indicator applied to the same 5-minute chart of the EUR/USD forex pair that we used previously. The upper and lower blue lines are the Bollinger bands and the orange line that runs in the middle is the simple moving average.
With this example, we see the 20-period and 2-standard deviation settings to adapt this forex scalping indicator to spot entry and exit signals.
Note how the bands expanded during periods where price trended and contracted during consolidation periods. Also, note how price tends to revert to the simple moving average or the opposite side of the Bollinger bands after price breached either side of the upper or lower bands.
This reversion in price behaviour at the extreme ends of the Bollinger bands is what traders look for when using this indicator to scalp the forex market.
Using a larger timeframe, like the 15-minute, to identify the main trend direction (as determined previously), then only sell setups would have been taken using the Bollinger band scalping method. Sell entries presented themselves each time that a candle closed above the upper 2-standard deviation Bollinger band.
With this simple strategy, a trader can decide on various exit signals. A position can either be closed when price reaches the centre simple moving average line (orange boxes) or whenever price reaches the opposite Bollinger band or closes below it (green boxes).
Stochastics
The stochastic indicator is a price momentum oscillator that compares a particular closing price of a forex pair to a range of prices over a set period of time. Traders generally use this indicator to spot overbought and oversold market conditions when a market is trading sideways.
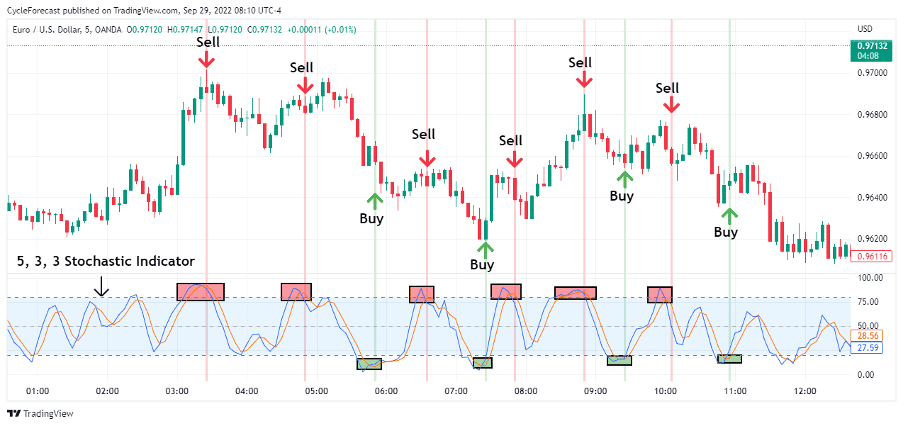
Source: TradingView
The chart image above again shows the same time period of the EUR/USD forex pair but with the stochastics indicator applied to the lower chart panel.
The stochastic indicator consists of two main components. The first component comprises two horizontal lines that lie at a value of 80 and 20. These lines indicate the levels where a market is considered overbought or oversold.
The second component is two moving lines, the %K line (blue line), which shows price reaction to momentum, and the %D line (orange line), which is the stochastics’ moving average.
These terms used to describe the components of the stochastic might sound very technical or confusing at first, but for the sake of this article, all you really need to know is how the indicator is typically used to spot overbought and oversold conditions.
Related Articles
Note what happened every time that the blue and orange lines moved above the overbought level (red boxes) and then crossed each other afterwards – reversals to the downside occurred. These areas where the two lines crossed each other, after they entered an overbought/oversold condition, are indicated by the red and green vertical lines on the chart. It is signals like these that scalpers look out for to before they enter their trades.
Knowing that the larger trend direction on the 15-minute timeframe was bearish, then short positions could have been taken at each point where the blue line crossed below the orange line from within an overbought condition.
Exits could have been taken each time the two lines entered an oversold condition and then crossed back upward again. The stochastic settings used in this example would have resulted in more trade setups than with the SMA’s and Bollinger band indicator setups.
Important note: More setups are not necessarily a good thing because there will be instances where there is no follow-through in price, with the fourth sell setup, for example. This does not only apply to the stochastic indicator but to other indicators as well.
Most scalping strategies will therefore rely on combining a couple of indicators that are designed to show different conditions to help a trader with spotting the best entry opportunities.
Other Technical Indicators
Apart from the well-known and popular indicators mentioned above, another forex scalping indicator worth mentioning is the Relative Strength Indicator (RSI). The RSI is a price momentum oscillator (just like the stochastic indicator) which measures the speed of price movements and is also used to spot overbought/oversold market conditions.
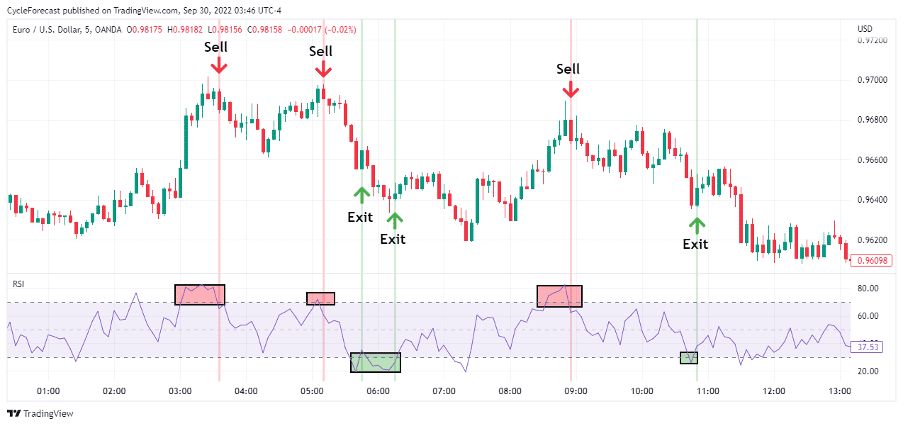
Source: TradingView
Our final chart example again shows the same chart as before, but this time with the RSI indicator applied to it. This time the RSI generated less sell signals than the Stochastic indicator but did a great job at finding the lower highs that occurred during the same downtrend.
The Best Forex Brokers for Scalping
| Broker | Features | Regulator | Platforms | Next Step | |
|---|---|---|---|---|---|
 Your capital is at risk
Founded: 2014 Your capital is at risk
Founded: 2014 |
|
FSPR | MT4 | ||
 Your capital is at risk
Founded: 2006 Your capital is at risk
Founded: 2006Europe* CFDs ar... |
|
ASIC, FSA, FSB, MiFID | MetaTrader4, Sirix, AvaOptions, AvaTrader, Mirror Trader | ||
|
Between 74-89 % of retail investor accounts lose money when trading CFDs |
|
ASIC, FCA | MetaTrader 4, MetaTrader 5, cTrader | ||
|
|
|
ASIC, CySEC, IFSC | MT4 Terminal, MT4 for Mac, Web Trader, iPhone/iPad Trader, Droid Trader, Mobile Trader, MT5 | ||
 Your capital is at risk
Founded: 2006 Your capital is at risk
Founded: 2006 |
|
CySEC, DFSA, FCA, FSB, SIA | MetaTrader4, MetaTrader5, cTrader, FxPro Edge (Beta) | ||
|
|
|
CySEC, FSC, FSCA, MISA | MT4, MT5, OctaTrader | ||
The best forex indicators for scalping are generally the ones that have stood the test of time and that have performed consistently well under changing market conditions. Although you might come across more complex scalping indicators or trading systems, it is often best for a beginner trader to not over complicate the process.
The forex scalping indicators presented in this article are used by beginner and expert traders and although they might be used in different combinations or strategies, they are highly effective at finding the best scalping opportunities.
Don’t Trade Before you see this!
We consulted our team of experts and put together 10 tips to help improve your trading.
These tips could help make you a better trader – and we’re giving them away for free!
Related Articles

Forextraders' Broker of the Month
BlackBull Markets is a reliable and well-respected trading platform that provides its customers with high-quality access to a wide range of asset groups. The broker is headquartered in New Zealand which explains why it has flown under the radar for a few years but it is a great broker that is now building a global following. The BlackBull Markets site is intuitive and easy to use, making it an ideal choice for beginners.