
If you have been an active forex trader for any length of time, then you have already realised the importance of volatility. All financial markets are known to range more often than follow trends, but ranging periods in the forex world can take place nearly 75% of the time. The key to success, especially if you focus on a formidable trend, is to recognise when a ranging market is approaching an end.
Several volatility indicators have been developed to assist in this task. If volatility is simply the rate of change in prices, then why are there so many variations for calculating this variable? Yes, a Simple Moving Average (SMA) may suffice and may be enhanced with an exponential weighting process, but the objective of these indicators is twofold. First, calculate the variable, and second, present a visual depiction that helps the trader to know when to react.
How is volatility calculated? An SMA and an Average True Range (ATR) indicator employ a straightforward method involving basic additions, subtractions, and divisions of opening and closing prices over a chosen time period. The Keltner Channel and the Donchian Channel indicators use SMAs and ATR measurements to arrive at three-banded representations. These measures, however, tend to be lagging by nature and do not react as quickly to changing market conditions as desired.
John Bollinger, a financial analyst, focused on improving technical analysis techniques, discovered that the application of statistical concepts to measuring volatility might effectively improve the ability to visually observe shifting price behaviour in a timely manner. A simple moving average would form the core, but bands would be placed either side of the middle line at a distance of two standard deviations.
The resulting three-banded system became an overlay on the pricing chart, directly associating with the movements depicted by candlesticks. Bands would naturally constrict when prices entered a ranging phase and expand when a new trend began to take shape. This ‘accordion effect’ became a popular signal for a majority of forex traders. When the ‘squeeze’ was on, it was time to prepare for an eventual breakout or reversal.
In the following article, we will discuss the use of standard deviations, how they can be used as a volatility calculator in forex, and how to use these concepts when trading in the forex market. Lastly, if you are searching for a safe forex broker with a great reputation, we will share our list of the Best Forex Brokers, based on our in-depth, continually updated reviews.
What is a Standard Deviation?
In his studies, Bollinger realised that a standard deviation was an excellent way to measure the dispersion of prices from a mean value in real-time. In simple terms, when prices spread out, the standard deviation could be used to gauge the severity of the spreading behaviour. From statistics, a standard deviation is the square root of the variance.
If you were never fond of making statistical calculations, you need not fear. Modern trading platform software handles the computations instantaneously in the background. Bollinger Bands incorporate the most popular process for using statistical methods to ascertain shifts in volatility by calculating two standard deviations from the mean on both sides of the centreline.
When prices suddenly break out, they often adhere to an outer boundary for several periods – an indication that prices do not necessarily obey normal distribution rules. Expanding bands, however, denote increasing volatility, while the converse is also true.
How to Calculate Volatility using Standard Deviation
Bollinger Bands are a volatility calculator and typically use a 20-period source of data points. A typical data point will be the average of the high, low, and closing price for a single period. An SMA then provides the Mean point values. Calculate one Standard Deviation (STD) by:
- For each of 20 points, deduct the Mean, and square the result
- Calculate the average of these values
- Take the square root of this average
To construct the bands, add 2 STDs to the Mean for the upper band value, and subtract 2 STDs from the mean for the lower band value. [C, D]
How Can Volatility Calculations Be Used in Forex Trading?
Let’s start by looking at an hourly chart for the EUR/GBP currency pair, courtesy of eToro:
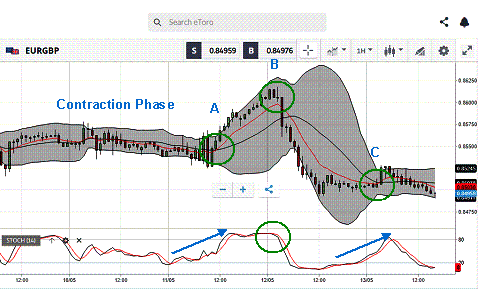
Source: eToro
Annotations have been added to aid in our analysis and discussion. The Bollinger bands encompass the grey-shaded region about the candlesticks. The red line on the chart is an Exponential Moving Average for the same 20 periods as the Bollinger midline. We have also inserted a Stochastics indicator on the bottom of the chart. This oscillating indicator tends to be more responsive to trends in a forex context.
The tight Contraction Phase on the left warns us that a change is imminent, but timing will come when volatility accelerates and the bands expand. Our other two indicators will assist in determining the direction of prices in the near term. Green circles suggest optimal entry and exit points. The bands expanded, but Stochastics pointed to a reversal. When the bands contracted once again, it was time to close the position.
The Best Forex Brokers
Are you looking for a forex broker to be your business partner on your trading adventure? This task need not be a daunting one. We are here to assist you in your endeavour by providing a current list of the best forex brokers for your consideration:
| Broker | Features | Regulator | Platforms | Next Step | |
|---|---|---|---|---|---|
 Your capital is at risk
Founded: 2014 Your capital is at risk
Founded: 2014 |
|
FSPR | MT4 | ||
 Your capital is at risk
Founded: 2006 Your capital is at risk
Founded: 2006Europe* CFDs ar... |
|
ASIC, FSA, FSB, MiFID | MetaTrader4, Sirix, AvaOptions, AvaTrader, Mirror Trader | ||
|
Between 74-89 % of retail investor accounts lose money when trading CFDs |
|
ASIC, FCA | MetaTrader 4, MetaTrader 5, cTrader | ||
|
|
|
ASIC, CySEC, IFSC | MT4 Terminal, MT4 for Mac, Web Trader, iPhone/iPad Trader, Droid Trader, Mobile Trader, MT5 | ||
 Your capital is at risk
Founded: 2006 Your capital is at risk
Founded: 2006 |
|
CySEC, DFSA, FCA, FSB, SIA | MetaTrader4, MetaTrader5, cTrader, FxPro Edge (Beta) | ||
|
|
|
CySEC, FSC, FSCA, MISA | MT4, MT5, OctaTrader | ||
Concluding Remarks
Measuring volatility changes is the lifeblood of any trading strategy. Quick changes in value connote a change in investor sentiment and an opportunity for trading for profit. Using statistical concepts of standard deviations in the form of Bollinger Bands has become a popular tool for traders to observe shifts in volatility, but this banded system does not necessarily reveal the direction that prices might take in the near term. It is highly recommended to use an additional indicator, one from the oscillator family, to work in tandem with Bollinger Bands for these important insights.

Forextraders' Broker of the Month
BlackBull Markets is a reliable and well-respected trading platform that provides its customers with high-quality access to a wide range of asset groups. The broker is headquartered in New Zealand which explains why it has flown under the radar for a few years but it is a great broker that is now building a global following. The BlackBull Markets site is intuitive and easy to use, making it an ideal choice for beginners.