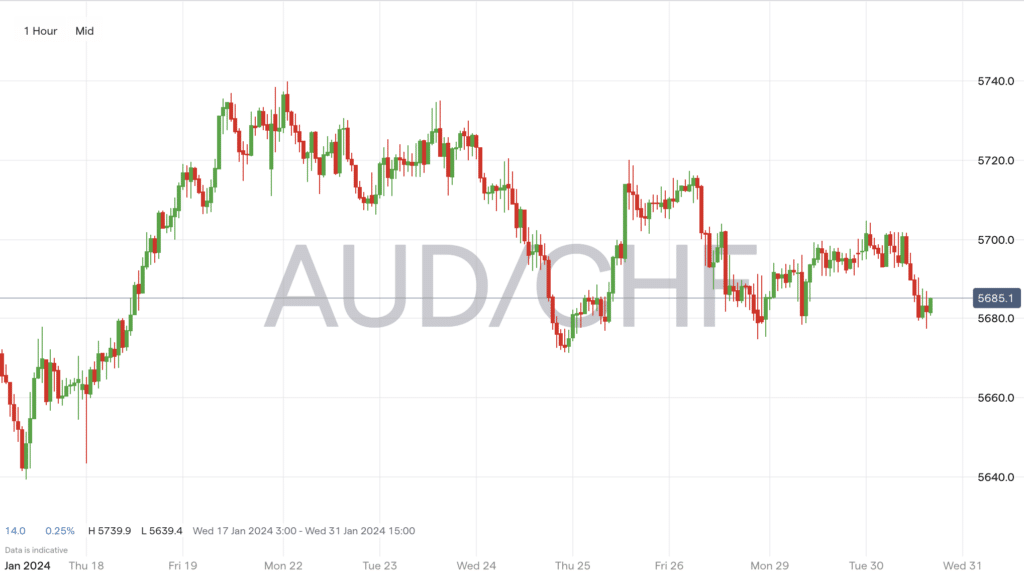
The Australian Dollar and Swiss Franc (AUDCHF) currency pair has shown interesting developments recently. Technical analysis reveals that the AUDCHF has been trading within a key technical confluence zone. This is critical for understanding potential market movements.
AUDCHF Technical Analysis
Currently, the AUDCHF is exhibiting signs of a downtrend. Indicated by lower lows and lower highs on the weekly chart. The moving averages also suggest a bearish trend. The 20-period moving average is positioned below the 50-period moving average. The Swiss Franc has faced pressure against other major currencies, which could potentially influence any technical analysis of the AUDCHF pair.
In the daily timeframe, the AUDCHF is trading higher within a bullish trend channel, but there are signs of momentum loss. This is indicated by a narrow-range candle in the recent price action. This suggests that the bulls are not in complete control. The stochastic oscillator is also a point of interest; if it crosses below the 80 level, it might signal further erosion of upward momentum.

Source: IG Markets
Key Fundamental Factors
Regarding fundamental analysis of AUDCHF, inflation has been a significant factor for the Australian economy. The Consumer Price Index (CPI) data for Australia showed an increase in inflation, mainly due to rising transport prices. This inflationary pressure leads to speculation about the Reserve Bank of Australia potentially tightening its monetary policy.
In contrast, Switzerland’s economy has been experiencing stagnant GDP growth with resilient employment market conditions. The Swiss National Bank maintained its benchmark rate, despite market expectations for an increase, due to the effectiveness of previous monetary tightening.
For traders and investors, a key price level for AUDCHF to watch is 0.5850. This aligns with the 23.6% Fibonacci retracement level and the upper end of the bearish trend channel. If the pair breaks beyond 0.5890 and sustains it, we could see a move towards the 38.2% Fibonacci retracement level at 0.5976.
Related Articles
 Between 74-89% of CFD traders lose
  Your capital is at risk
  Your capital is at risk
  Your capital is at risk