
The surge in global commodity prices continues with copper and oil leading the way.
Oil Prices – It’s Not Just About Increased Demand
The price of crude has risen by almost 50% in the space of only three months. At Thursday’s opening of European markets US Oil (WTI) was trading at $61.60, up 2.17% from Monday, the time of its continued price surge being highlighted by the Forex Traders analysts.
Increased demand for oil looks a certainty as economic activity resumes and populations become more mobile. The supply-side factors are, as ever, trickier to gauge.
- So far, OPEC members are demonstrating an ability to stick to their designated production quotas. Therefore, the OPEC Plus convention due to take place on the 4th of March is an important date for those holding positions.
- Shale gas production imploded in 2020 as gas and oil prices tumbled through zero dollars per barrel. Kick-starting production will take time and require backing from investors willing to take the risk of being blown away by OPEC again.
- Trade volumes in the oil markets are holding up. The daily chart shows consistent volumes passing through the exchanges, which points to ‘real-world’ activity rather than speculators. Businesses across the globe are literally pump-priming in anticipation of a return to something like normality.
US Oil (WTI) – 1M price chart – 100 SMA coming in to play
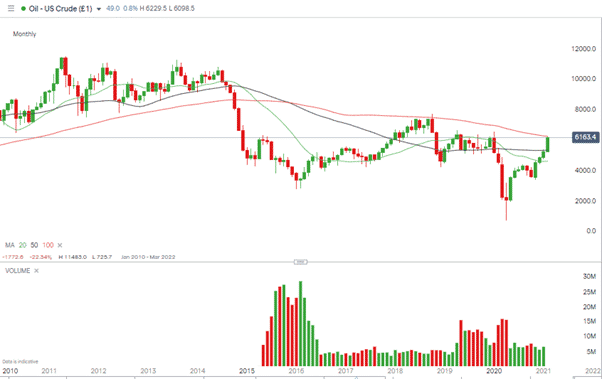
Source: IG
Technical resistance / Upside target for US Oil (WTI):
- $62.43 – Monthly 100 SMA
- $65.46 – 2020 high (January)
US Oil (WTI) – 1D price chart – volumes holding up
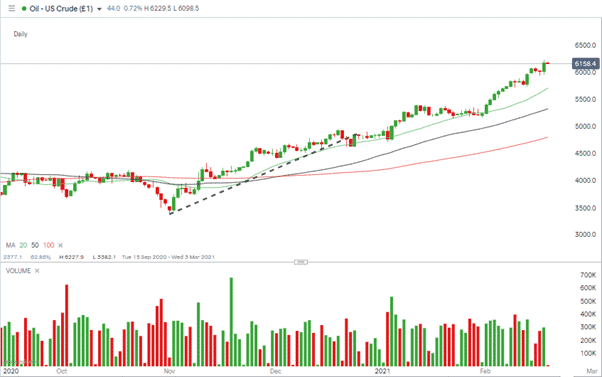
Source: IG
Copper – New Demand and Limited Supply
Copper’s 10% month-to-date price rise for February reflects demand and supply working in tandem.
- Production levels are down as Covid-19 restrictions make it logistically more challenging for miners to extract the metal. With a lot of extraction based in less developed countries, this could be an ongoing issue as vaccine rollouts face country specific challenges.
- The metal is earmarked as an essential requirement in the global restructuring needed to move away from carbon heavy activity towards renewables.
- With clean energy infrastructure and clean transportation likely to receive funding as part of pandemic recovery plans, the metal could be at the beginning of a super-cycle – an extended period of price rises seen only four times in the last century.
Copper – 1D price chart – Super Cycle?
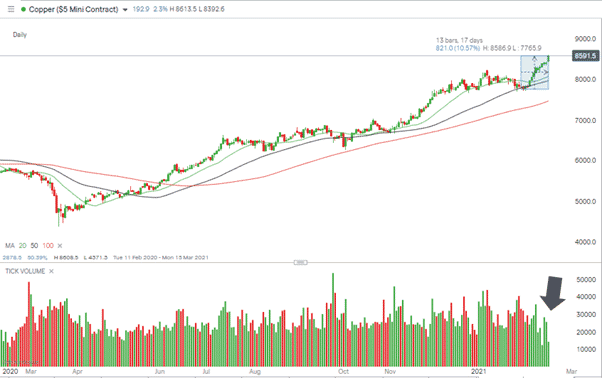
Source: IG
The price of copper has been trending upwards for months – it’s up 96% since March 2020 and the price move continues to build momentum. Copper has now posted ten consecutive up days but a recent drop in trade volumes raises some questions.
Monday’s trading volumes were the lowest for more than one year (since the 17th of February 2020). That could reflect that there is not enough of the metal to satisfy demand due to the mentioned supply problems. Alternatively, it could reflect the capitulation of sellers – short interest being exhausted as only buyers enter the market.
Copper – 1D price chart – Low Trading Volumes
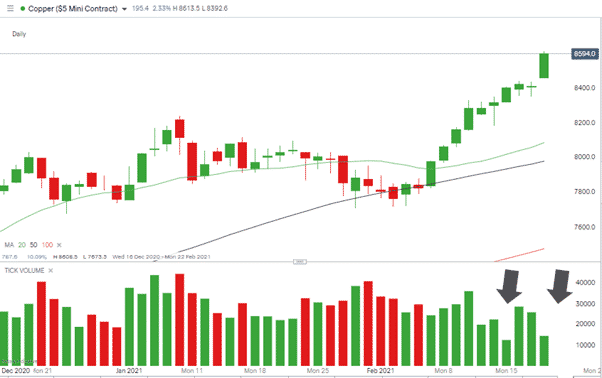
Source: IG
The 1.06% daily price rise on Monday points to the path of least resistance being upwards; however, a short-term pullback sometimes follows a capitulation.
If you want to know more about this topic, please contact us at [email protected]
 Your capital is at risk
  Your capital is at risk