
With a few months of the trading month left, it’s clear the September Effect has played out in a textbook manner. The historically inspired dip in risk-asset valuations was highlighted by the Forex Traders analysts at the beginning of the month. The subsequent sell-off came into play between the 6th and the 20th of September, with the Dow Jones Industrial Average index losing 5.30% in value over that time.
The September Effect – Dow Jones Industrial Average Daily Price Chart
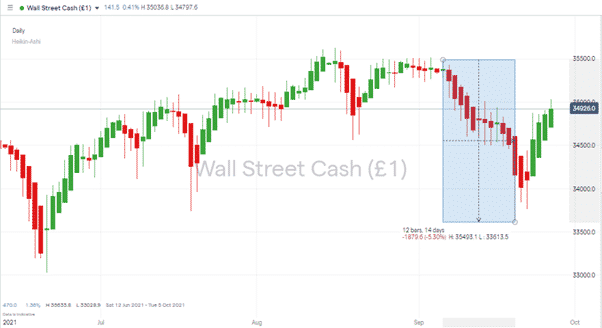
Source: IG
Everyone likes to make a good call on market moves. Those who lightened their long positions or sold short at higher levels even had a chance to buy the dip and bounce into the end of last week. What’s possibly as important as generating a positive return is that the September effect played out as expected. To have some normality, and technical and historical trends guiding the market, denotes a watershed moment after 18+ months of prices being driven by Covid. It doesn’t mean the Covid risk has gone away; just that other price drivers are becoming increasingly important.
Is Now the Time to Buy Stocks?
This return to normality coincides with the start of the fourth quarter, with October to December historically being one of the most bullish trading periods of the calendar year. Will the ‘business as usual’ sentiment in the market mean that prices push on from here?
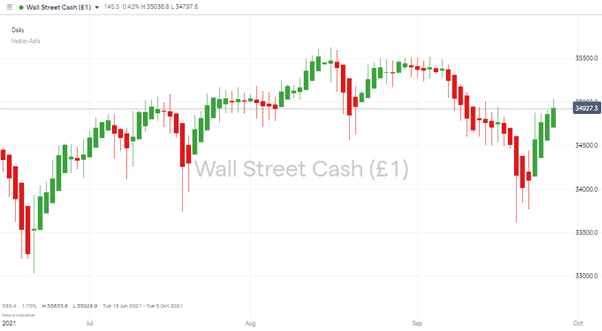
With Technical Analysis becoming increasingly influential, the bullish price action in major global equity indices is worth noting.
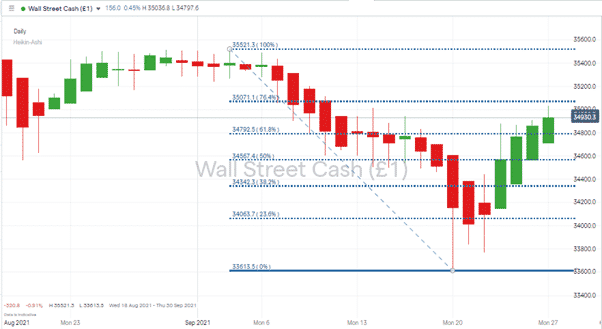
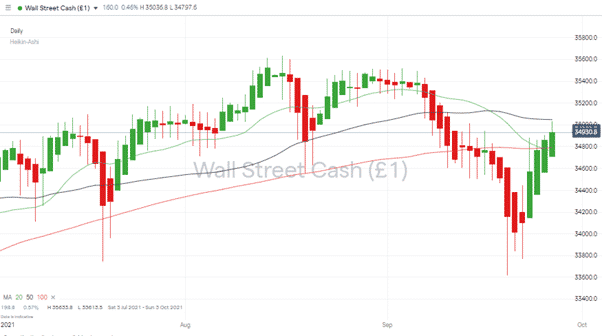
On the daily price chart, the Heiken Ashi candle pattern for DJIA points to further upward momentum. On Friday, the 76.4% Fib retracement at 35071 provided some resistance, and the Daily 50 SMA sits at 35048. Having these two indicators sitting so close to each other means further price gains can’t be guaranteed; however, with the 100 SMA providing support at 34,790, there is a chance for those going long to place a stop loss 140 points below the current price of 34,929. A healthy enough risk-return profile for a strategy based on markets breaking upwards and printing all-time highs again. A recent all-time high of DJIA being 35,633 posted on the 16th of August and 700+ points above current price levels.
Dow Jones Industrial Average Daily Price Chart – Bullish Heiken Ashi Candles
Dow Jones Industrial Average Daily Price Chart – Fib Retracement
Dow Jones Industrial Average Daily Price Chart – SMAsWhat is the End Quarter Effect?
Some historical strength seen in Q4 comes into play closer to year-end. The ‘Santa Rally’ is as much about portfolio managers driving up prices in quiet markets to window dress their year-end returns as it is seasonal good cheer.
Getting involved in the trend too early can also be hazardous. In terms of win-loss ratios, October isn’t the best month, and sell-offs in that month have a severe track record. Many will be waiting for another calendar milestone to pass before jumping in, with Halloween being used by many as a trigger to go long.
If you have been the victim of a scam, suspect fraudulent behaviour, or want to know more about this topic, please contact us at [email protected]
 Your capital is at risk
  Your capital is at risk