- Bank of England expected to raise interest rates by 25 basis points
- UK inflation rates are still red-hot, whilst other economies are showing signs of cooling
- What are the price targets for GBPUSD?
Differences in economic fundamentals are driving the price of GBPUSD higher; the question is, how high will it go? UK inflation is still close to double figures, while other economies, most notably the US, are seeing prices fall. With UK interest rates expected to continue rising in relative terms, that will result in international investors buying into the UK currency.
Bank rate hike to tackle inflation
A 25-basis point rise in UK interest rates looks already priced in by the markets. With the fundamentals laid out as they are, few are expecting the Bank of England to hold back when it meets on Thursday.
The medium-term prognosis also points to UK inflation rates outstripping those of the country’s peer group – it takes time to drain inflation out of the system. When the US CPI inflation report was released on Wednesday, the headline year-on-year figure of 4.9% was 0.1 percentage point less than the previous month. More significantly, it was the 10th straight month of slower inflation, from the peak above 9% last summer.
The technical indicator that could stifle sterling’s rise
Fundamental factors might determine the direction of a trend, but recent price action in GBPUSD highlights the role key technical indicators have played in guiding the price surge which started in September 2022. They could also offer a clue as to how price might move in the near future.
GBPUSD – Daily Price Chart 2021 – 2023 – Fib Retracement Levels
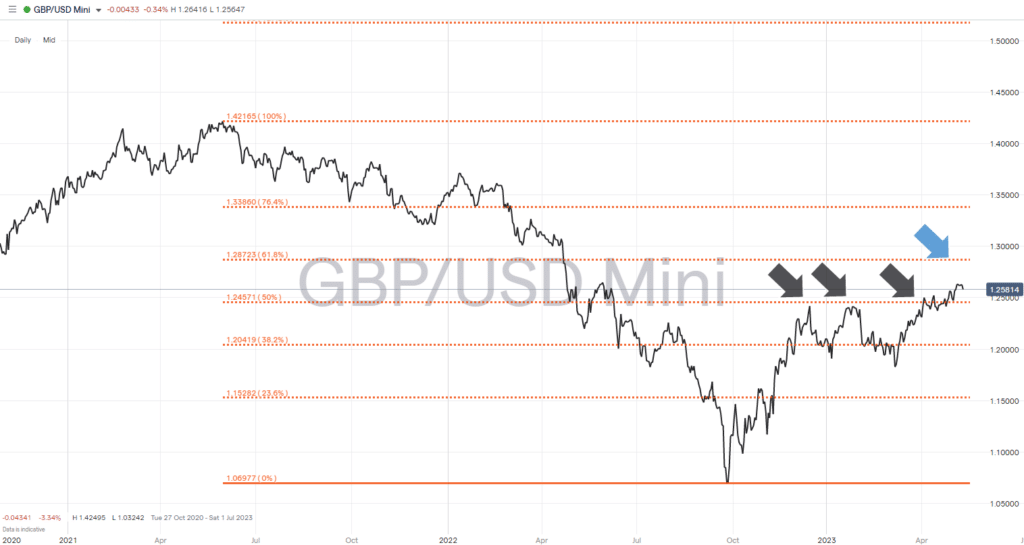
Source: IG
The 2021 – 2023 price chart shows the Fibonacci retracement levels of the price slump from May 2021 to September 2022. It pinpoints how the 50% Fib level of 1.24571 acted as resistance between December 2022 and April 2023. There were repeated tests of that price level before GBPUSD finally headed higher – and the next Fib, the 50% level, comes into play if GBPUSD reaches 1.28723.
Those who expect the price of GBPUSD to at least test 1.28723 would, from current price levels, post a 2.21% gain on that trade. That approach is supported by the fact that the RSI on the Daily Price Chart is currently at 59.9, meaning the currency pair is far from being overbought. There’s plenty of room for another upward price move to take place. But given that it took price four months to break through the 50% Fib some traders can be expected to lock in profits if price does reach 1.28723.
GBPUSD – Daily Price Chart 2023 – With RSI
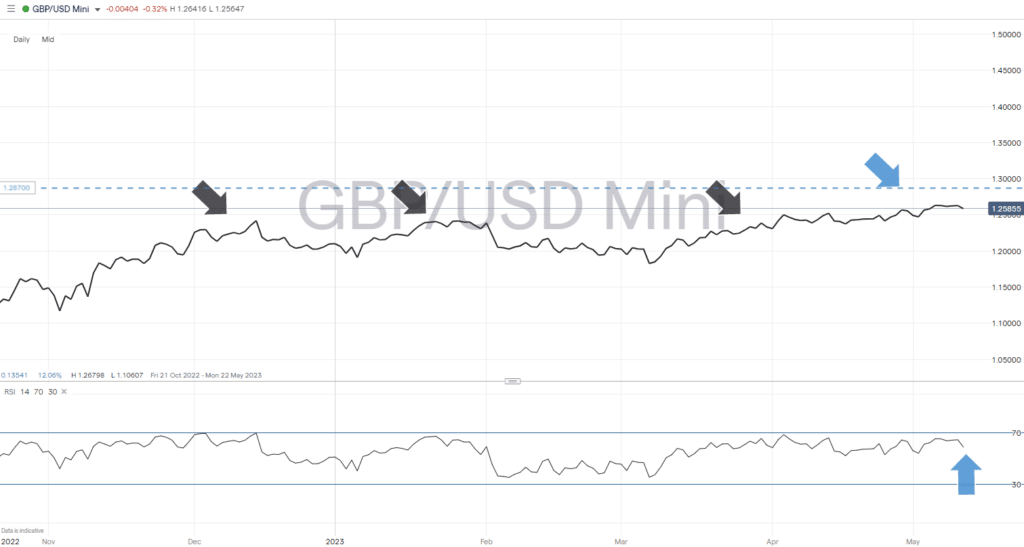
Source: IG
People also Read:
- WEEKLY FOREX TRADING TIPS – 2023.05.08
- The Week Ahead – 8th May 2023
- The Best and Worst Performing Currency Pairs in April 2023
If you have been the victim of a scam, suspect fraudulent behaviour, or want to know more about this topic, please contact us at [email protected]
 Your capital is at risk
  Your capital is at risk