
FOCUS ON: Markets Pause Ahead of US Inflation Numbers
- Low trading volumes as markets pause for breath
- US CPI inflation report to be released on Wednesday
- Price volatility levels expected to pick up ahead of the Bank of England interest rate decision on Thursday
Trading Ideas
We created this Weekly Tips section to share possible trade entry and exit points based on our technical analysis. We also have other methods to validate our trades which we can’t publicly share that help to increase their success. All our trades include entry and at least one target price. Stop losses are applied at the reader’s discretion. Our strategies typically trade with a wide stop loss, and risk is further mitigated by trading in small sizes.
Instrument | Price | Hourly | Daily |
GBP/USD | 1.2603 | Strong Buy | Strong Buy |
EUR/USD | 1.0996 | Strong Sell | Neutral |
USD/JPY | 134.86 | Strong Sell | Neutral |
S&P 500 | 4,130 | Strong Buy | Strong Buy |
NASDAQ 100 | 13,256 | Strong Buy | Strong Buy |
FTSE100 | 7,775 | Buy | Neutral |
Gold | 2,022 | Strong Sell | Buy |
Crude Oil WTI | 72.56 | Sell | Sell |
Bitcoin | 27,514 | Buy | Buy |
Ethereum | 1,837 | Buy | Neutral |
UTC: 09:04
US Dollar Basket Index (DXY)
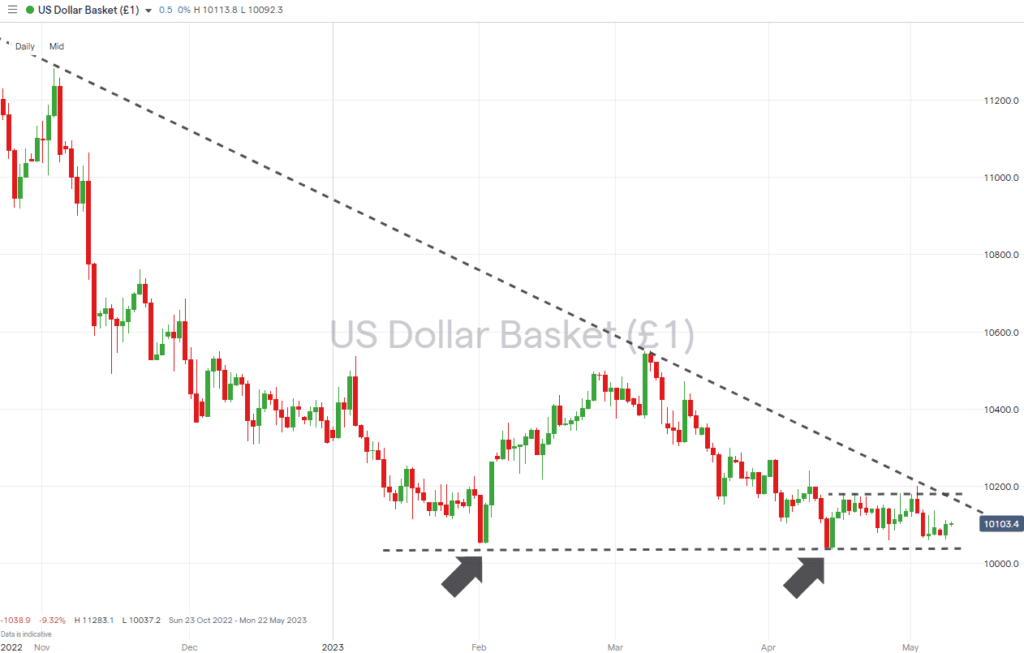
The Federal Reserve’s update on interest rates and Non-Farm Payroll jobs numbers have been and gone, but the US Dollar Basket index is still trading within the trendlines of a descending wedge pattern. This week’s release of crucial CPI inflation numbers could trigger a breakout of the wedge, and with the RSI on the Daily Price Chart at 61.0, there is potential for that break to be in either direction.
US Dollar Basket Chart – Daily Price Chart – Descending Wedge Pattern
Source: IG
US Dollar Basket Chart – Hourly Price Chart
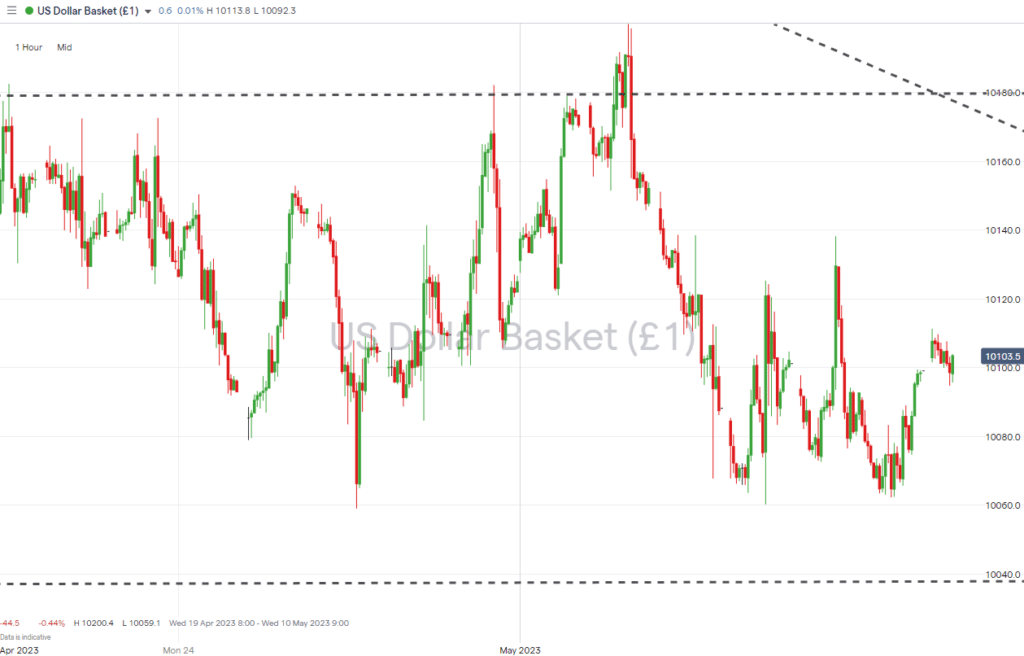
Source: IG
Short positions
- Entry Level 1: 101.56 – Region of the upper trendline of the long-term price fall from September 2022. Can be expected to offer significant resistance and an opportunity to short-sell the dollar.
- Price Target 1: 101.19 – Region of the 20 SMA on the Daily Price Chart.
- Price Target 2: 100.38 – Price low printed on 13th April.
- Price Target 3: 100.00 – In extension, psychologically important price level.
- Stop Loss: > 101.83 – Region of the 50 SMA on the Daily Price Chart.
Long positions
- Entry Level 1: 101.19 – The 20 SMA on Daily Price Chart has guided the downward move in the DXY index since mid-March. A break of that key metric would signify a shift in momentum and potentially form a new upward trend.
- Price Target 1: 101.56 – Resistance formed by the long-term downward trendline.
- Price Target 2: 102.00 – Month-to-date price high of 2nd May.
- Stop Loss: < 100.00 – ‘Round number’ support level.
GBPUSD
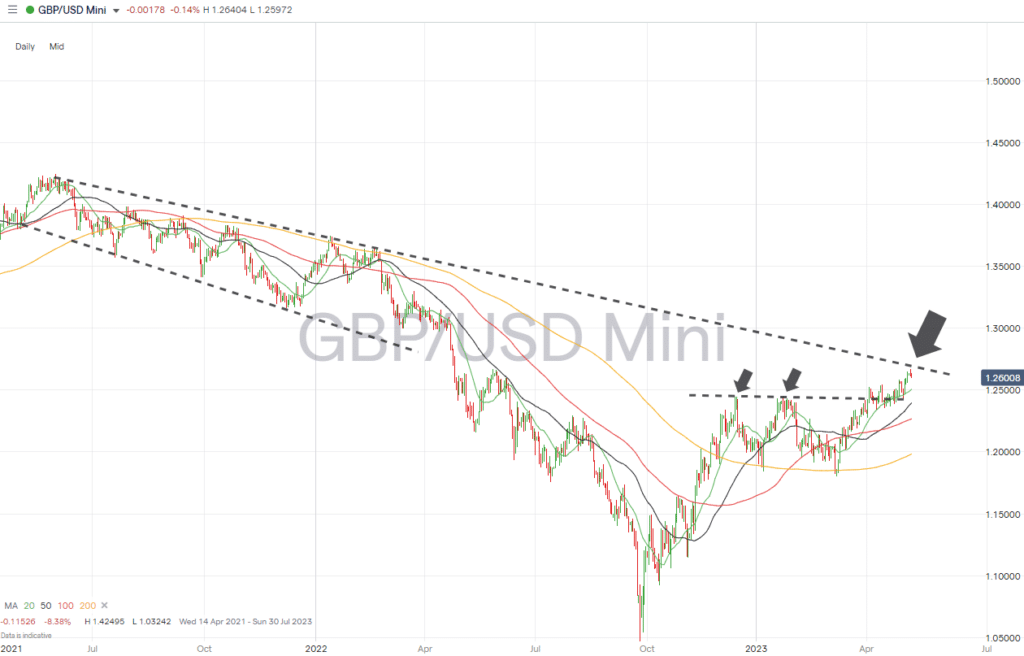
Cable was the big mover among the major currency pairs last week. Sterling gained in value by more than 1.50% against the dollar while EURUSD and USDJPY price moves were within a 0.5 percentage point range.
UK inflation reports point to the economy still overheating, and with the Bank of England meeting on Thursday, another interest rate hike looks likely. With ‘dovish’ comments coming out of the Fed last week, the GBPUSD upward price trend could have more room to run.
Daily Price Chart – GBPUSD Chart – Daily Price Chart
Source: IG
GBPUSD Chart – Hourly Price Chart
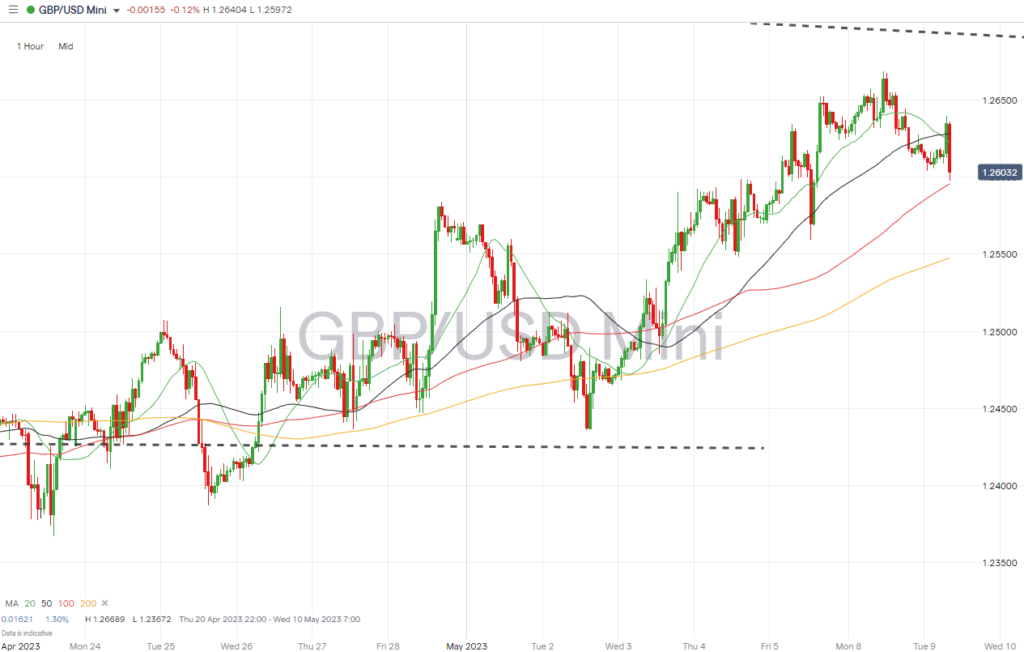
Source: IG
Short positions
- Entry Level 1: 1.26689 – Monday’s price high and region of the long-term downward trendline which started forming in May 2021.
- Price Target 1: 1.25079 – Region of 20 SMA on Daily Price Chart and ‘round number’ support of 1.25 price level.
- Price Target 2: 1.24216 – Support/resistance offered by price highs of December 2022 and January 2023.
- Stop Loss: > 1.27120 – Region of the 100 SMA on the Weekly Price Chart.
Long positions
- Entry Level 1: 1.25079 – Buying into weakness which takes price to the region of the 20 SMA on the Daily Price Chart.
- Price Target 1: 1.26689 – Region of resistance marked by intra-day price high of Monday 8th May.
- Price Target 2: 1.28785 – in extension, region of the 50 SMA on the Monthly Price Chart.
- Stop Loss: < 1.24216 – Support/resistance offered by the ‘double-bottom’ price highs of December 2022 and January 2023.
EURUSD
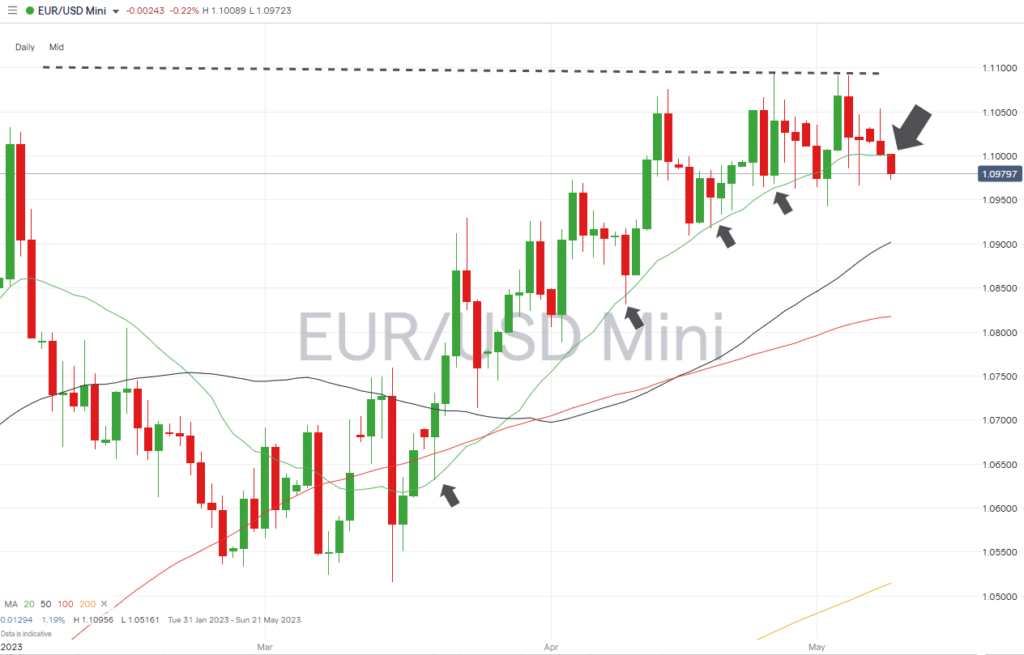
The Eurodollar upward price move from mid-March has stalled at the 1.10 price bar. Despite repeated attempts to break through, the 1.109 price has now formed a sideways trading pattern marked by a break of the 20 SMA on the Daily Price Chart.
With the key 20 SMA metric now breached, traders will see opportunities to trade price moves in either direction.
EURUSD Chart – Daily Price Chart – Break of 20 SMA
Source: IG
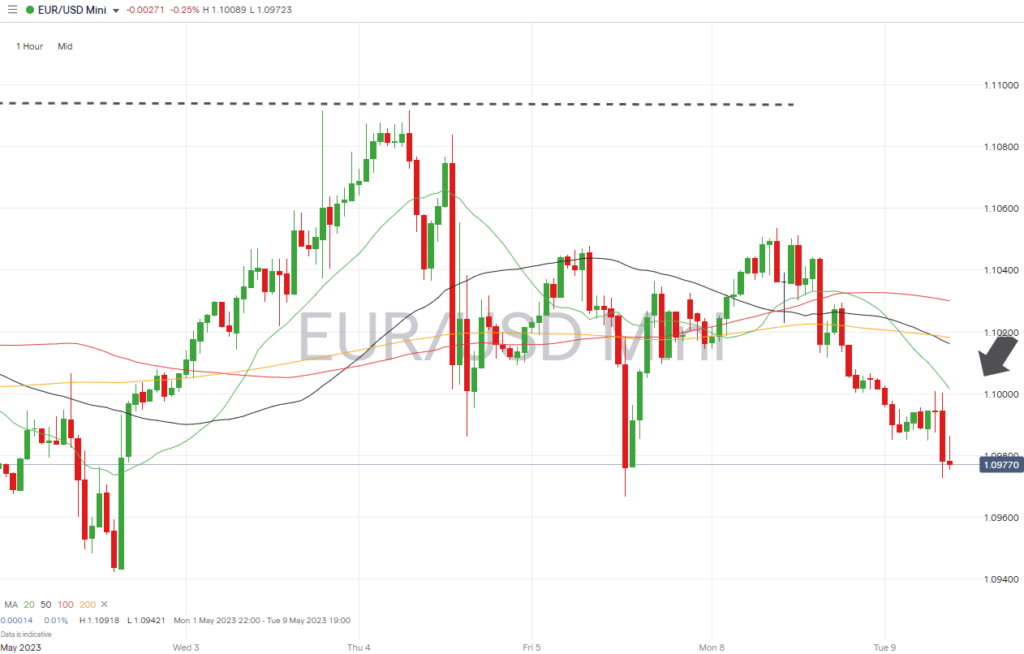
EURUSD Chart – Hourly Price Chart
Source: IG
Short positions
- Entry Level 1: 1.09421 – A break below the intraday price low printed on Tuesday 2nd May would confirm a break of the ‘higher highs and higher lows’ swing-low pattern of the Eurodollar bull run that started in early March.
- Price Target 1: 1.09019 – Region of the 50 SMA on the Daily Price Chart.
- Price Target 2: 1.05161 – In extension, swing-low formed on 15th March.
- Stop Loss: > 1.1000 – Psychologically important price level.
Long positions
- Entry Level 1: 1.09839 – Using a momentum-based strategy and buying EURUSD if it breaks back above the 20 SMA on the Daily Price Chart.
- Price Target 1: 1.1000 – ‘Round number’ resistance.
- Price Target 2: 1.10956 – Year-to-date price high printed on 26th April.
- Stop Loss: < 1.09093 – Swing-low price low of 13th April.
Indices
S&P 500
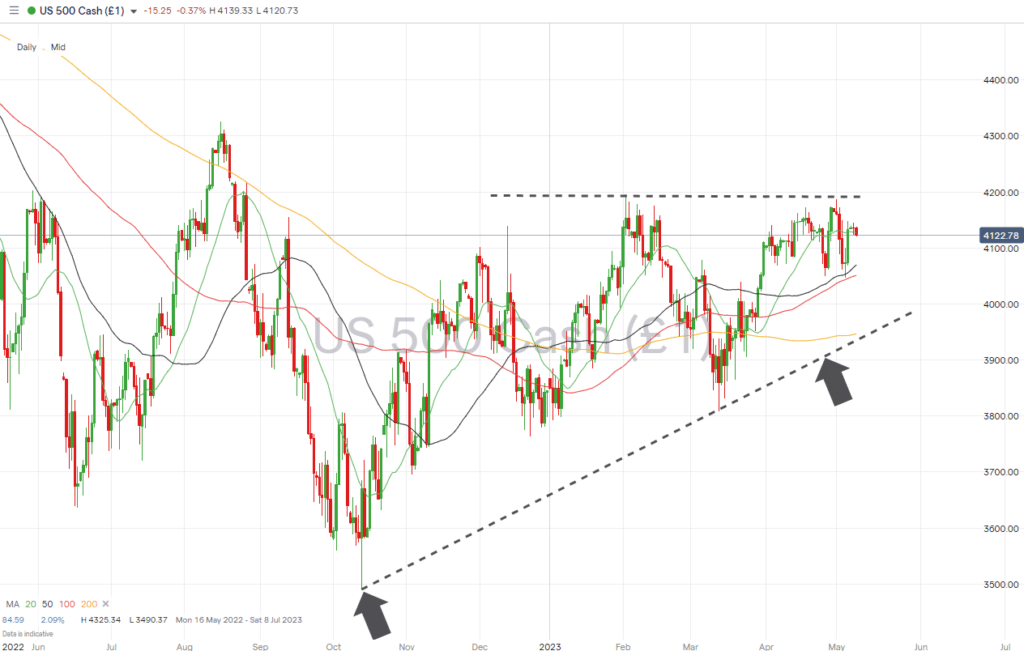
The upward momentum in US stocks has paused in anticipation of the US inflation report due out on Wednesday. With earnings season drawing to a close, stock prices are left at a potential tipping point due to major indices so far failing to break out of ascending wedge patterns.
S&P 500 Chart – Daily Price Chart – Ascending Wedge Pattern
Source: IG
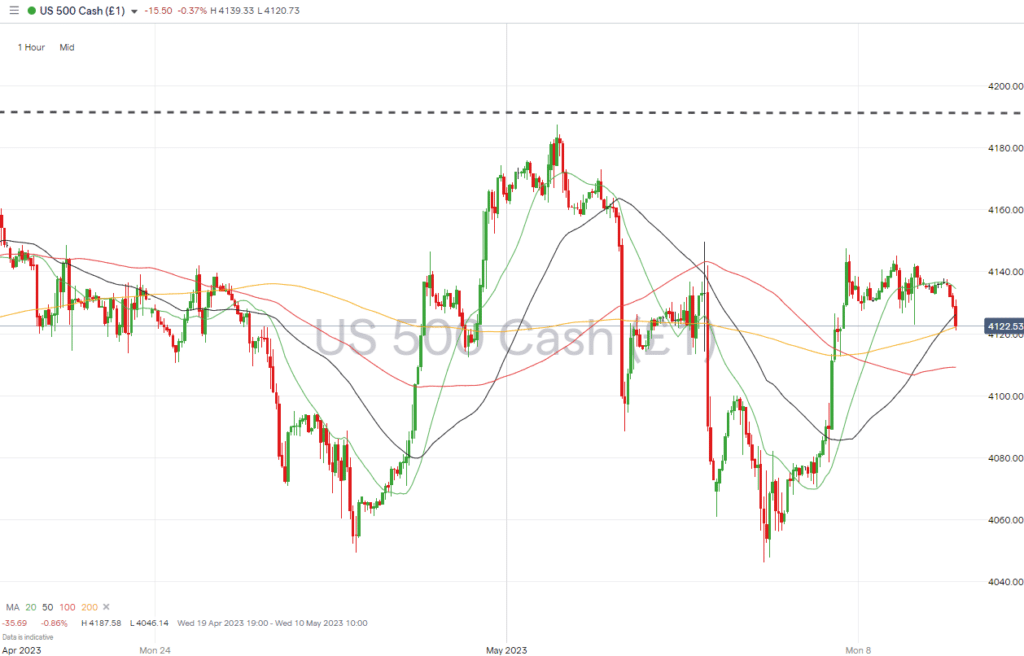
S&P 500 – Hourly Price Chart
Source: IG
Short positions
- Entry Level 1: 4,187 – Price high of 1st May. Just below the year-to-date price high of 2nd February 2023 (4,195).
- Price Target 1: 4,127 – Region of the 20 SMA on Daily Price Chart.
- Price Target 2: 4,046 – In extension, intraday price low of 4th May when 100 SMA on Daily Price chart acted as support.
- Stop Loss: > 4,200 – Round number resistance level.
Long positions
- Entry Level 1: 4,069 – 50 SMA on the Daily Price Chart. Additional support offered by 100 SMA at 4,050.
- Price Target 1: 4,195 – Year-to-date price high of 2nd February 2023.
- Price Target 2: 4,200 – Region of 100 SMA on the Weekly Price Chart and ‘round number’ price level.
- Stop Loss: < 4,00 – Psychologically important price level.
Crypto – Bitcoin & Ethereum
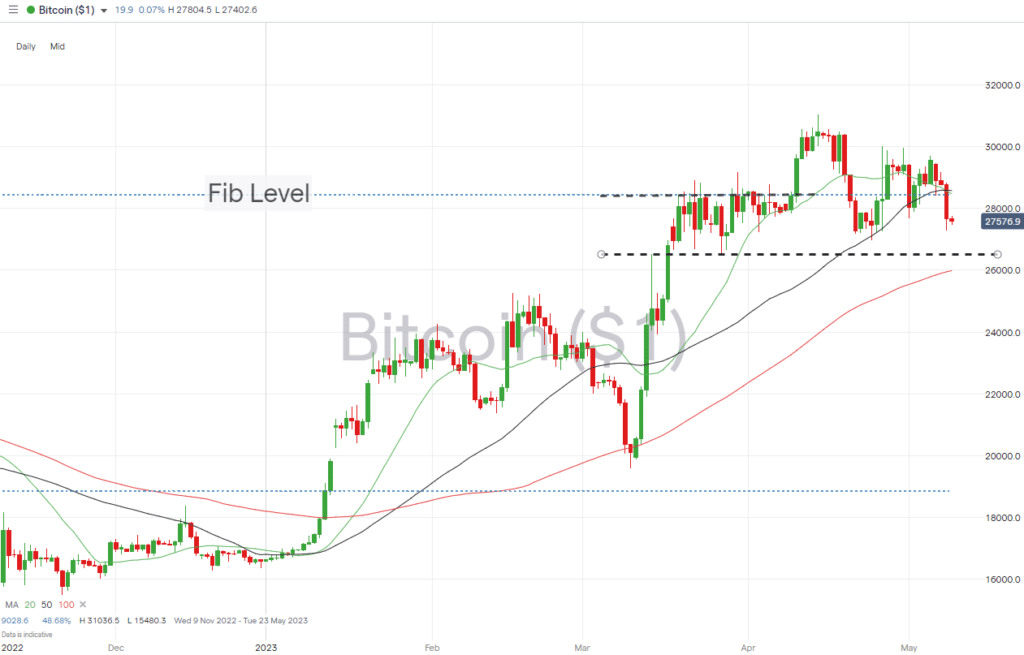
Prices of Bitcoin and Ethereum ended last week flat, +0.45% and -0.11%, respectively, but an uptick in price volatility marked the intervening days. Bitcoin traded within a price range of 27,667 to 29,694, and ETH traded between 1,806 and 1,999.
Both coins continue to trade in the region of key Fibonacci retracement levels—metrics which, in both cases, have guided price since mid-March.
Bitcoin Price Chart – Daily Price Chart
Source: IG
Bitcoin Long positions
- Entry Level 1: 26,981 – Swing-low of 24th April 2023.
- Price Target 1: 28,476 – Convergence of the 20 and 50 SMA on the Daily Price Chart.
- Price Target 2: 28,952 – Level of 61.8% Fib retracement formed by the upwards price move in Bitcoin recorded between February 2019 and November 2021.
- Stop Losses: < 26,536 – Support level marked by price action on 27th March, just above the 100 SMA on the Daily Price Chart.
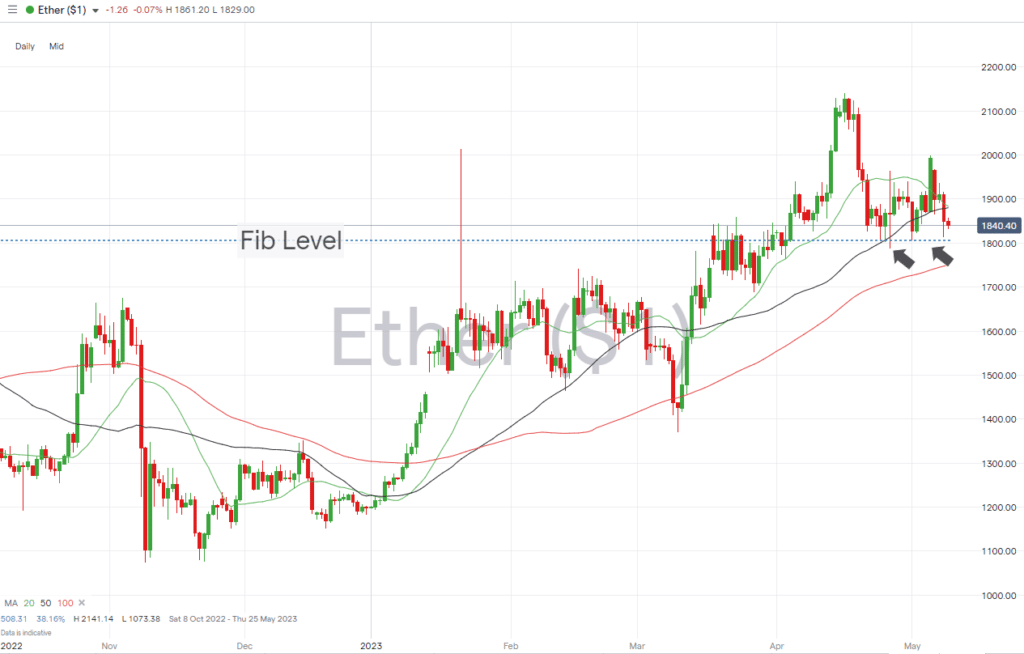
Ethereum
Ethereum Chart – Daily Price Chart
Source: IG
Ethereum Long positions
- Entry Level 1: 1,806 – 23.6% Fibonacci retracement level of the November 2021 to June 2022 price crash.
- Price Target 1: 1,880 – Convergence of the 20 and 50 SMAs on the Daily Price Chart.
- Price Target 2: 2,000 – Psychologically important round-number support/resistance level.
- Price Target 3: 2,141 – In extension, price high of 16th April 2023.
- Stop Losses: < 1,749 – Region of the 100 SMA on the Daily Price Chart.
Risk Statement: Trading financial products carries a high risk to your capital, especially trading leverage products such as CFDs. They may not be suitable for everyone. Please make sure that you fully understand the risks. You should consider whether you can afford to take the risk of losing your money.

Forextraders' Broker of the Month
BlackBull Markets is a reliable and well-respected trading platform that provides its customers with high-quality access to a wide range of asset groups. The broker is headquartered in New Zealand which explains why it has flown under the radar for a few years but it is a great broker that is now building a global following. The BlackBull Markets site is intuitive and easy to use, making it an ideal choice for beginners.