
- CPI and PPI inflation data are to be released and will offer an insight into the health of the US economy.
- Sterling currency pairs are also likely to respond to UK inflation and GDP data releases.
- Japan’s GDP report is due out on Tuesday.
After two relatively quiet weeks in terms of economic reports, things look set to hot up in the coming days. A selection of key news releases will offer investors an update on the state of the global economy, with the US CPI and UK unemployment reports likely to trigger increased price volatility on Tuesday. On Wednesday, we will see the release of the UK CPI, US PPI, and China’s Industrial Production numbers. All these events come when the prices in risk-on assets have rallied on the back of central bank guidance considered to be turning dovish. Is the good news already priced in, leaving room for a fallback in price, or is this the start of a new bull rally?
US Dollar
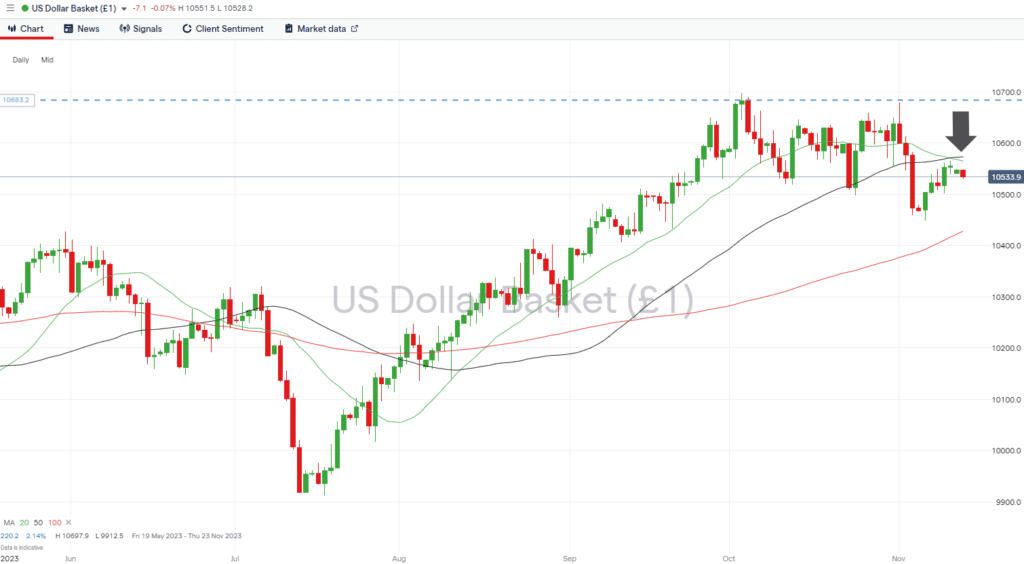
The recent decision by Jerome Powell and his team at the US Federal Reserve to leave interest rates unchanged has been followed by an increase in investor risk appetite. That has resulted in the US Dollar Basket index posting a 1.35% loss on a month-to-date basis as cash has flowed away from the security of the greenback into other assets and currencies.
The coming week sees the release of two reports that can be assumed to be important guides for the FOMC. The first is the US CPI inflation report due out at 1.30 pm (GMT) on Tuesday – where month-on-month inflation levels are forecast to be 0.1%, and any reading lower than that is a sign that the Fed does have room to take a more relaxed approach to interest rate policy. The ‘factory-gates’ PPI inflation report, announced at 1.30 pm (GMT) on Wednesday, can also be expected to act as a catalyst for currency price moves.
The index is currently trading below two key metrics, which can be expected to offer resistance to upward price movements. The 20 and 50 SMAs on the Daily Price Chart sit at 105.64 and 105.72, respectively, and a break of these would leave room for price to carry on rising before the year-to-date high of 106.97 comes into play.
US Dollar Basket Index – Daily Price Chart – Year-to-date highs and SMA Resistance
Source: IG
- Key number to watch: Tuesday 14th November at 1.30 pm (GMT). US CPI (October). Analysts forecast prices to have risen 3.8% year-on-year and 0.1% month-on-month (MoM), from 3.7% and 0.4%, respectively. Core CPI is expected to rise 3.8% year-on-year and 0.3% month-on-month.
- Key price levels: Resistance in the region of 105.64 – 105.72, where the 20 and 50 SMAs on the Dailly Price Chart are converging.
EURUSD
The biggest Eurozone-centric news release of the week comes out on Tuesday at 10.00 am (GMT). Investors will be able to gauge confidence levels in the German economy when the ZEW index is updated, with analysts expecting it to move from a negative to positive sentiment reading and to shift from -1.1 to +1.0.
Traders of EURUSD will likely see more significant price moves triggered by the CPI and PPI inflation data due from the US on Tuesday and Wednesday. That means the mid-week trading sessions will likely throw up trading opportunities as short and long-term trends form.
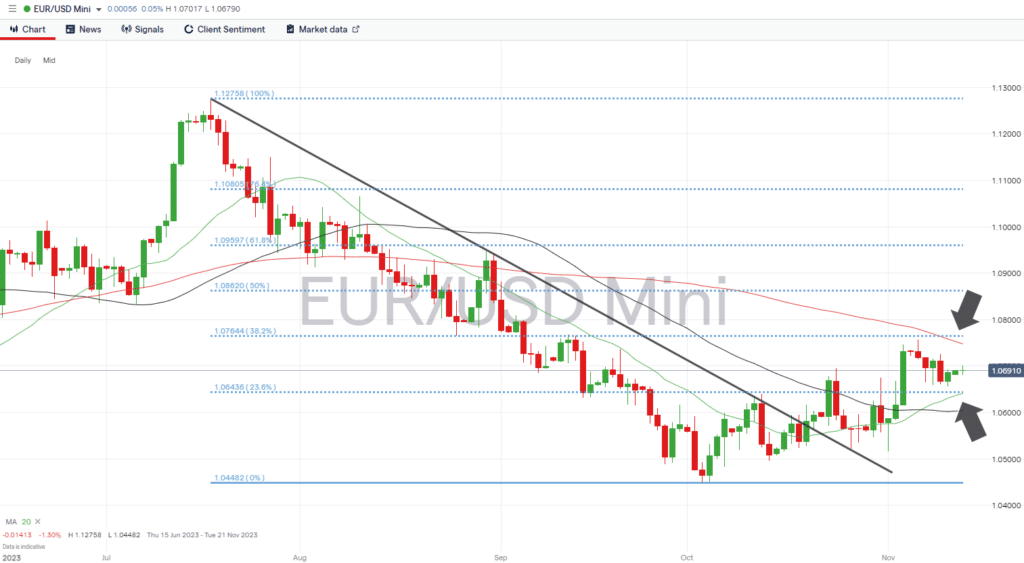
Price is currently trading mid-range between the support and resistance offered by a convergence of important SMA’s and Fibonacci retracement levels of the price fall recorded between July and October. Support comes in the form of the 23.6% Fib level (1.06436) and the 20 SMA on the Daily Price Chart (1.06413), and resistance sits around the level of the 100 Daily SMA (1.07476) and the 38.2% Fib level (1.07644).
Daily Price Chart – EURUSD – Daily Price Chart – Fib Levels and SMAs
Source: IG
- Key number to watch: Tuesday 14th November at 1.30 pm (GMT). US CPI (October). Analysts forecast prices to have risen 3.8% year-on-year and 0.1% month-on-month (MoM), from 3.7% and 0.4%, respectively. Core CPI is expected to rise 3.8% year-on-year and 0.3% month-on-month.
- Key price levels: Support level in the region of 1.06413 – 1.06436. The 23.6% Fib level and 20 SMA on the Daily Price Chart.
GBPUSD
Traders of GBPUSD will be keeping a close eye on the US inflation data announced on Tuesday and Wednesday, but there are other UK news releases that will need to be factored into trading strategies. At 7.00 am (GMT) on Tuesday, the UK unemployment numbers for September will be announced. Analysts forecast unemployment to rise to 4.4%, and any signs that the jobs market is healthier than expected would increase the chances of further rate hikes by the Bank of England.
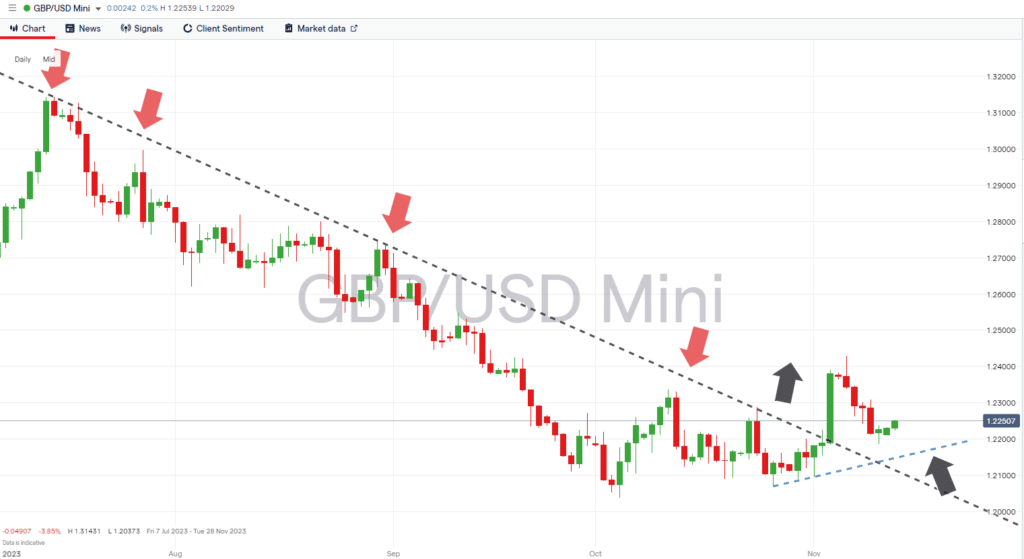
Daily Price Chart – GBPUSD – Daily Price Chart – Trendlines
Source: IG
- Key numbers to watch: Tuesday 14th November – UK Unemployment (September) 7.00 am (GMT). Wednesday 15th November – UK CPI (October) 7.00 am (GMT).
- Key price level: 1.2150 – Region of supporting trendline pattern began forming on 26th October.
USDJPY
The price of USDJPY could be impacted this week by a range of news announcements. The US inflation numbers will impact the USD side of the currency pair, but there is also news specific to Japan in the form of the Q3 GDP report due out at 11.55 pm (GMT) on Tuesday.
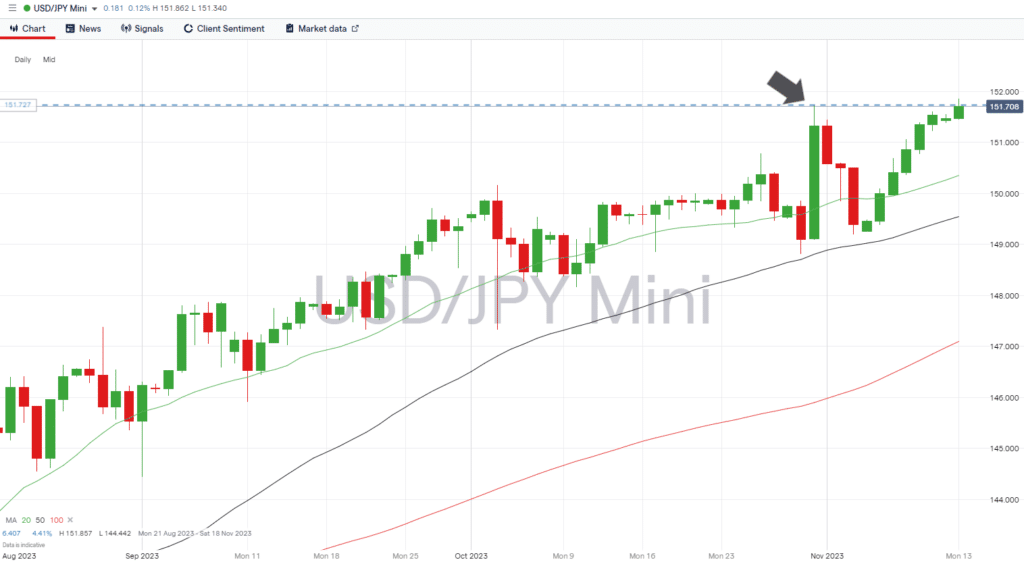
USDJPY – Daily Price Chart
Source: IG
- Key number to watch: Tuesday 14th November – Japan GDP (Q3) 11.55 pm (GMT) – Growth expected to fall to 0.6% year-on-year.
- Key price level: 151.736 – Previous year-to-date high recorded on 31st October. Previously acted as resistance but can now be expected to offer support.
Trade EURUSD with our top brokers:
| Broker | Features | Regulator | Platforms | Next Step | |
|---|---|---|---|---|---|
 Your capital is at risk
Founded: 2014 Your capital is at risk
Founded: 2014 |
|
FSPR | MT4 | ||
 Your capital is at risk
Founded: 2006 Your capital is at risk
Founded: 2006Europe* CFDs ar... |
|
ASIC, FSA, FSB, MiFID | MetaTrader4, Sirix, AvaOptions, AvaTrader, Mirror Trader | ||
|
Between 74-89 % of retail investor accounts lose money when trading CFDs |
|
ASIC, FCA | MetaTrader 4, MetaTrader 5, cTrader | ||
|
|
|
ASIC, CySEC, IFSC | MT4 Terminal, MT4 for Mac, Web Trader, iPhone/iPad Trader, Droid Trader, Mobile Trader, MT5 | ||
 Your capital is at risk
Founded: 2006 Your capital is at risk
Founded: 2006 |
|
CySEC, DFSA, FCA, FSB, SIA | MetaTrader4, MetaTrader5, cTrader, FxPro Edge (Beta) | ||
|
|
|
CySEC, FSC, FSCA, MISA | MT4, MT5, OctaTrader | ||
Risk Statement: Trading financial products carries a high risk to your capital, especially trading leverage products such as CFDs. They may not be suitable for everyone. Please make sure that you fully understand the risks. You should consider whether you can afford to take the risk of losing your money.