- The major currency pairs enter year-end trading mid-range in long-term price channels.
- The European, US, and UK data reports due to be released will shed light on the global economy’s health.
- The Bank of Japan will decide on its interest rate policy.
The run-up to the end of 2023 will allow forex traders time to reflect on the previous twelve months’ market activity and what might lie ahead in 2024. That shift in focus comes as a strong rally into risk-on assets, which started in November, continues to build momentum, with many investors taking the view that monetary tightening may have peaked. For the foreseeable future, there appears to be little reason to move away from focussing on the two key price drivers of 2023: inflation and interest rates. Even if interest rates have stopped going up, there are, as yet, few hints from central bankers as to when they might start to go down.
US Dollar
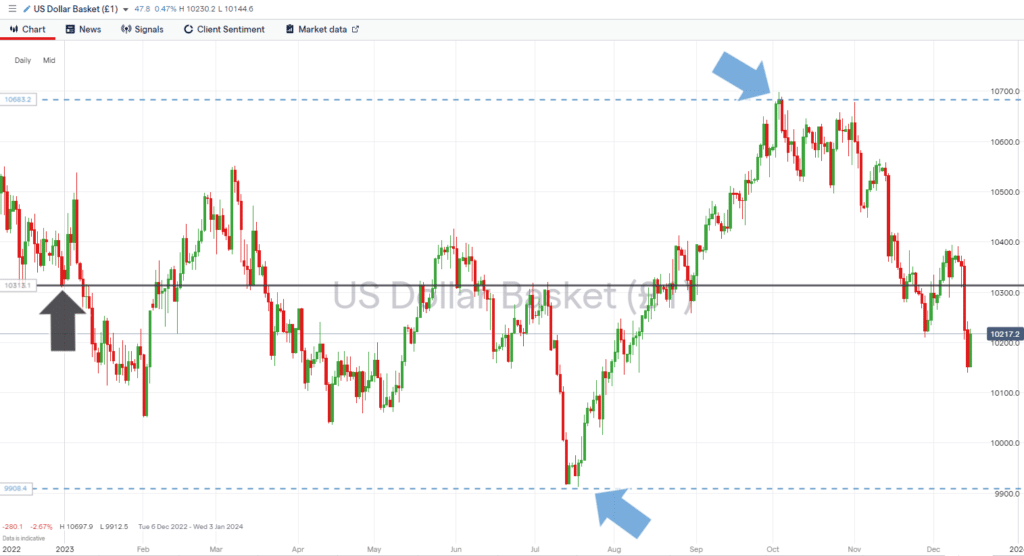
The 12-month price chart for the US Dollar Basket Index shows that as the end of December approaches, the index is trading within 1% of the opening price of the first trading session in January (103.43). That almost ‘unchanged’ price reading for the year belies the sometimes-dramatic moves that took place and created several trading opportunities around medium-term trends.
There has also been roughly equivalent divergence to the upside and downside, and that sideways channel will provide key support and resistance guidance in the coming months. Also of interest is that the year-to-date low and high were posted in the latter half of the year. Price volatility is picking up, which traders will have to factor into their strategy planning.
Very few major news announcements are due out of the US before the end of the year. Still, traders and analysts would do well to keep up to speed and track upcoming data points, primarily focusing on sentiment metrics. The Consumer Confidence report due out of the US on 20th December will offer an insight into how the all-important Christmas trading may have gone for retailers, and the Chicago PMI number released on 29th December will offer a steer on manufacturing confidence just before the new year of trading activity.
US Dollar Basket Index – Daily Price Chart – Increasing price volatility
Source: IG
Key number to watch: Tuesday 20th December 3.00 pm (GMT). US Consumer Confidence: Analysts forecast the confidence index to rise to 104 from 102.
Key price levels: 103.43 – Price could be drawn to the level at which it opened the year.
EURUSD
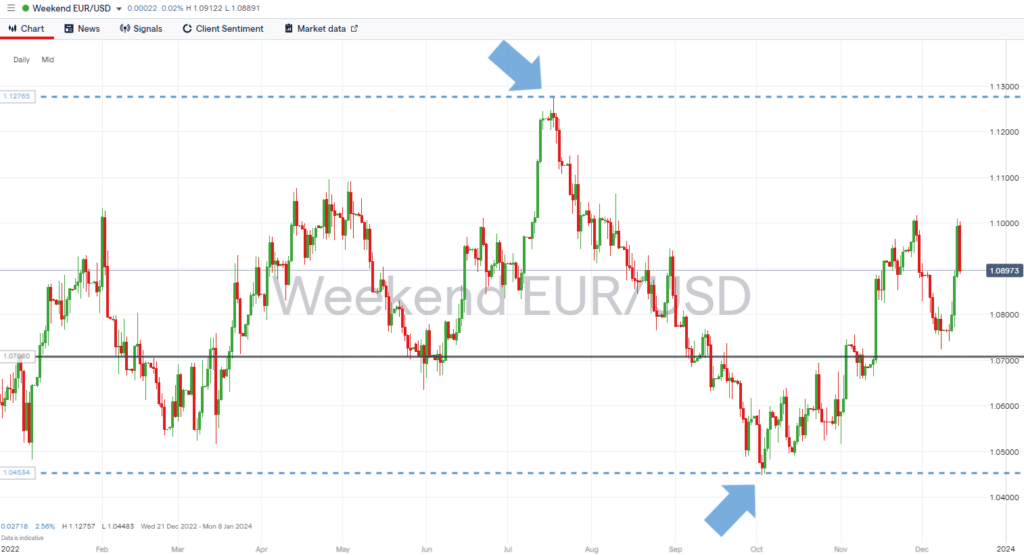
Given that the euro has the greatest weighting of any currency in the US Dollar Basket Index, it’s not surprising that the EURUSD price chart shows some similarities to that of the DXY index. The Eurodollar is ending the year trading mid-range between its year-to-date highs and lows, and more importantly, those peaks and troughs again occurred relatively recently. Increased price volatility could be a significant factor to consider going into 2024, and the following sentiment-based reports are more forward-looking than inflation and jobs data. They will offer a clue as to which direction any more dramatic move might be.
On Monday, 18th December, the German IFO Business Climate report will be released at 9.00 am (BST). Analysts expect an improvement in this index, with the number rising from 87.3 to 87.8. On 20th December, the mood of German consumers will be gauged when the GfK Consumer Sentiment report is released.
Daily Price Chart – EURUSD – Trading mid-range
Source: IG
Key numbers to watch: Monday 18th December at 9.00 am (GMT). German IFO Business Climate, Wednesday 20th December 7.00 am (GMT) GfK Consumer Sentiment.
Key price level: 1.1000 – Psychologically important ’round number’ price level, which acted as resistance on 29th November and 14th December.
GBPUSD
Traders of sterling-based currency pairs have important reports to consider before the end of the year. Not least, on 20th December, the UK inflation report for November is due to be published. Given that the Bank of England opted to keep interest rates unchanged last week, any signs that price inflation is stronger than expected would be uncomfortable reading for the Bank. Then, on 22nd December, Retail Sales data is released, with analysts currently forecasting an improvement in that number, from -0.3% to 0.4%.
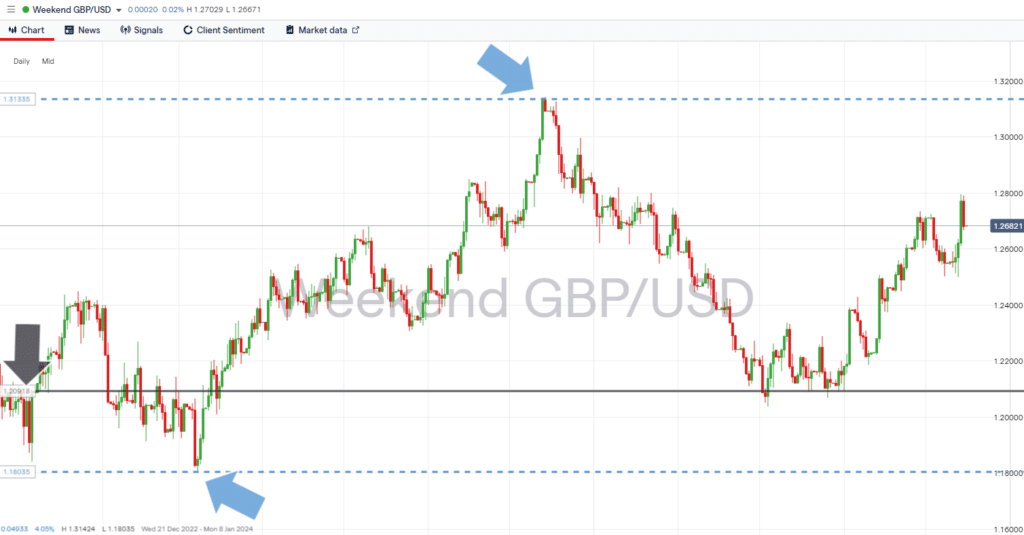
The 12-month price chart for GBPUSD shows that sterling’s rise against the US dollar has outstripped that of the euro. That could be due to UK inflation stubbornly refusing to fall as fast as the Bank of England would have liked, limiting the opportunities for the Bank to lower interest rates. Compared to the DXY index and EURUSD, it is also worth noting that the year-to-date low for GBPUSD occurred back in March, suggesting that price volatility in cable was spread out more evenly over the year.
Daily Price Chart – GBPUSD – Daily Price Chart – Bullish momentum
Source: IG
Key number to watch: Wednesday 20th December 7.00 am (GMT). UK Inflation report (November). Analysts forecast the UK inflation rate to fall from 4.6% in the previous month to 4.4%.
Key price level: 1.2500 – Region of supporting trendline and psychologically important ’round number’ price level.
USDJPY
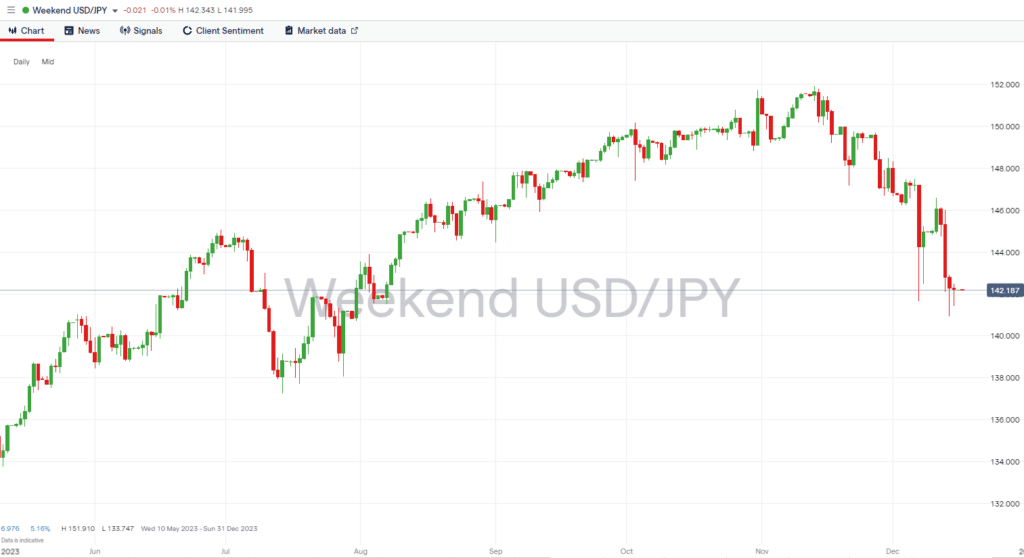
Traders of USDJPY can expect a busy run into the end of the year. The Bank of Japan will announce its latest decision on interest rates on Tuesday, 19th December, with analysts expecting the next rate move to be upward. Traders have driven down the price of the dollar-yen in anticipation of a hawkish move by the BoJ, but analysts are split on whether that rate hike will occur at the December meeting or in early 2024. That uncertainty means increased price volatility can be expected when the next rate decision is announced.
USDJPY – Daily Price Chart – Bearish price action
Source: IG
Key number to watch: Tuesday 19th December 3.00 am (GMT) – Bank of Japan interest rate decision.
Key price level: 145.29 – Region of 20 SMA on Daily Price Chart. Price has traded below this metric since 17th November.
Trade EURUSD with our top brokers:
| Broker | Features | Regulator | Platforms | Next Step | |
|---|---|---|---|---|---|
 Your capital is at risk
Founded: 2014 Your capital is at risk
Founded: 2014 |
|
FSPR | MT4 | ||
 Your capital is at risk
Founded: 2006 Your capital is at risk
Founded: 2006Europe* CFDs ar... |
|
ASIC, FSA, FSB, MiFID | MetaTrader4, Sirix, AvaOptions, AvaTrader, Mirror Trader | ||
 Between 74-89% of CFD traders lose
Founded: 2010 Between 74-89% of CFD traders lose
Founded: 2010Between 74-89 % of retail investor accounts lose money when trading CFDs |
|
ASIC, FCA | MetaTrader 4, MetaTrader 5, cTrader | ||
 Your capital is at risk
Founded: 2009, 2015, 2017 Your capital is at risk
Founded: 2009, 2015, 2017 |
|
ASIC, CySEC, IFSC | MT4 Terminal, MT4 for Mac, Web Trader, iPhone/iPad Trader, Droid Trader, Mobile Trader, MT5 | ||
 Your capital is at risk
Founded: 2006 Your capital is at risk
Founded: 2006 |
|
CySEC, DFSA, FCA, FSB, SIA | MetaTrader4, MetaTrader5, cTrader, FxPro Edge (Beta) | ||
 Your capital is at risk
Founded: 2011 Your capital is at risk
Founded: 2011 |
|
CySEC, FSC, FSCA, MISA | MT4, MT5, OctaTrader | ||
Risk Statement: Trading financial products carries a high risk to your capital, especially trading leverage products such as CFDs. They may not be suitable for everyone. Please make sure that you fully understand the risks. You should consider whether you can afford to take the risk of losing your money.