- The minutes of the last meeting of the Federal Reserve FOMC are due out on Wednesday.
- They will offer an insight into the approach adopted by central banks.
- The US Thanksgiving holiday on Thursday can be expected to result in a quiet close to the trading week.
The coming trading week will be foreshortened by the Thanksgiving holiday, which takes place on Thursday. With many traders also due to be out of the office on Friday, the markets will be afforded the chance to respond to the numerous economic reports which have recently hit the markets.
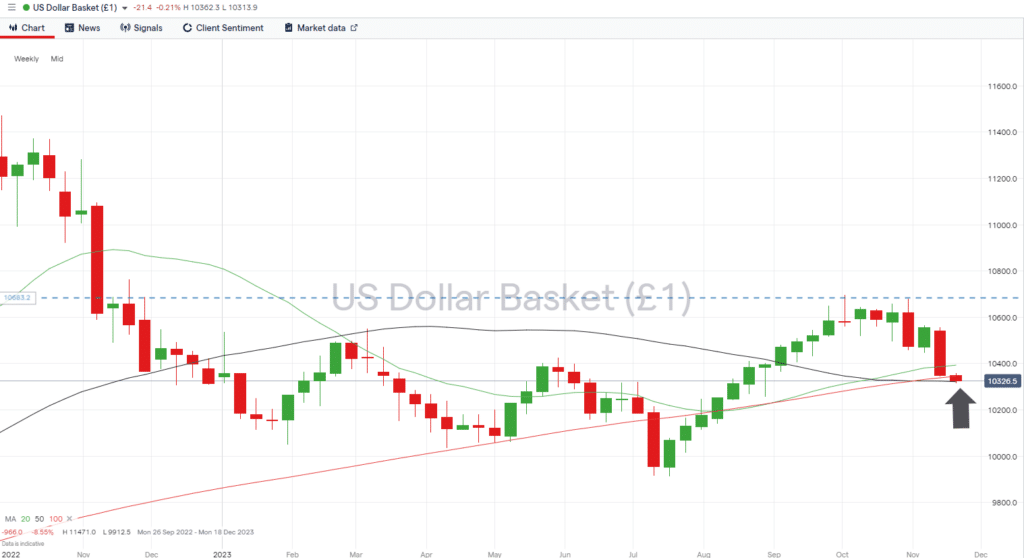
The optimistic mood which has gripped investors has triggered a phenomenon described as ‘No sell November’, but with the US Dollar Basket Index down more than 3% on a month-to-date basis, an interim period of price consolidation, or a short-term retracement, can’t be ruled out. With the Friday following Thanksgiving being ‘Black Friday,’ the big retailers’ sales figures will show whether the bullish surge is justified. The minutes of the last meeting of the FOMC, which are due at 7 pm (GMT) on Tuesday, will offer an insight into the thought processes of Jerome Powell and his team.
US Dollar
The dollar’s downward trend, which started on 1st November, has been triggered by relatively ‘hawkish’ guidance from the US Federal Reserve being accompanied by more ‘dovish’ decisions to leave interest rates unchanged. Traders wanting to take a view on this apparent disconnect and whether Jerome Powell’s narrative will be backed by further rate hikes have a chance on Tuesday to look into the situation more deeply. The release of the minutes of the last Fed meeting will lay out the views of all members of the FOMC in greater detail.
Earnings season is ending, but one trading update due on Tuesday could trigger increased price volatility in a range of asset classes. Market favourite NVIDIA (NVDA) has so far this year posted a +230% gain and is currently seen as a key bellwether of broader valuations in the tech sector.
US Dollar Basket Index – Daily Price Chart – Year-to-date highs and SMA Support

Source: IG
- Key number to watch: Tuesday 21st November 7.00 pm (GMT). Minutes of the last meeting of the Fed FOMC. Will reveal further detail on the discussions held and reasons given for keeping US interest rates unchanged at the previous FOMC meeting.
- Key price levels: 103.22 – 103.45 – Area on the Weekly Price Chart where two long-term SMA’s are converging. The 50 SMA can be expected to provide support, and the 100 SMA resistance.
EURUSD
Despite the upcoming US holiday, economic updates from the Eurozone look set to offer some degree of price volatility in the run-up to the close of the trading week. On Thursday, the German Manufacturing PMI index numbers will outline confidence levels among manufacturers in the German manufacturing sector. On Friday, the German IFO index will shed light on sentiment among a broader section of the Eurozone’s most important economy.
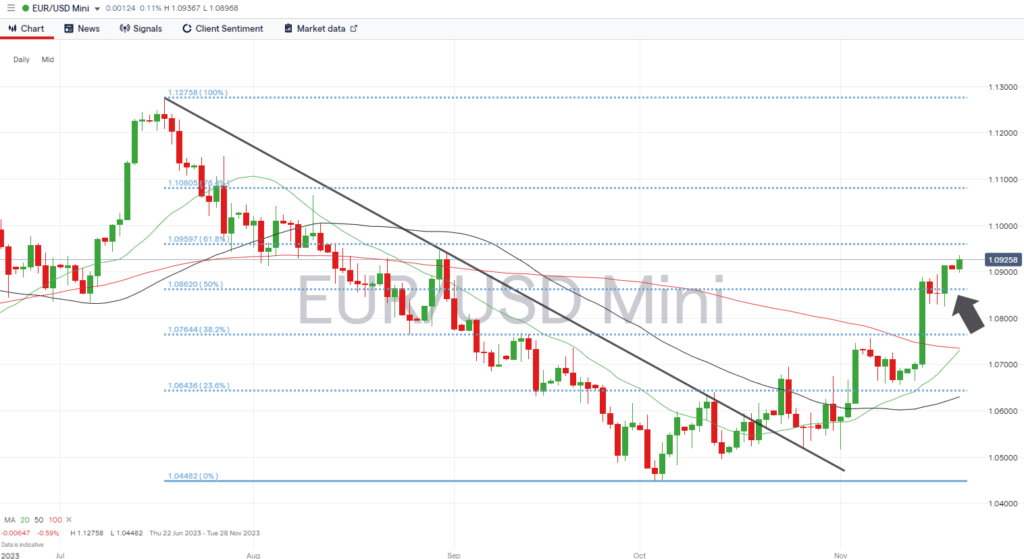
Last week’s +2% gain in the value of EURUSD saw the euro burst through the 50% Fibonacci retracement level of the July to October price slump. That level, 1.08620, can now be expected to offer support, and as long as it holds, the path of least resistance appears to be upward.
Daily Price Chart – EURUSD – Daily Price Chart – Fib Level support

Source: IG
- Key number to watch: Friday 24th November 9.00 am (GMT). German IFO index (November). Previous reading 86.9. This metric has the advantage of being forward-looking, so it offers an insight into what might occur in the future rather than what has happened in the past.
- Key price levels: 1.08620 – support formed by the 50% Fib retracement.
GBPUSD
Traders of sterling-based currency pairs can expect the Autumn Statement from Chancellor Jeremy Hunt to provide added price volatility and trading opportunities. With an election less than 12 months away, Hunt’s budget offers a last chance for him to manipulate the levers within his control in an attempt to secure political popularity: surprises in the form of tax cuts can’t be ruled out.
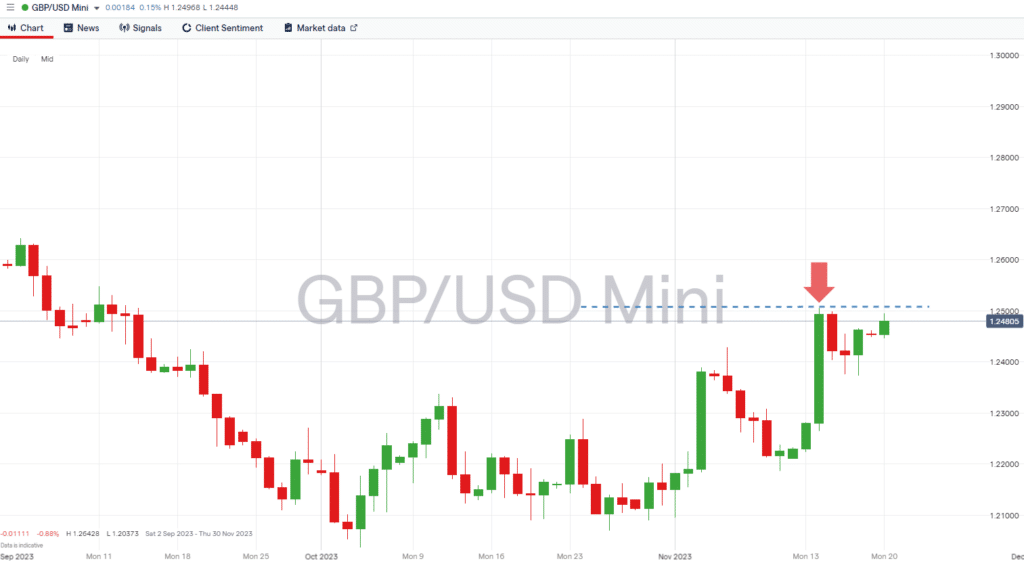
The intraday high of 1.25063 recorded on Tuesday 14th, November sits in the region of the 50% Fibonacci retracement (1.25167) of the long-term GBPUSD price fall between May 2021 and the closing price reported on 26th September 2022. A confirmed break of this resistance level could lead to further upward price movements.
Daily Price Chart – GBPUSD – Daily Price Chart – Resistance at 1.25063

Source: IG
- Key numbers to watch: Wednesday 22nd November – UK Autumn Statement 12.30 pm (GMT). Chancellor Jeremy Hunt will unveil the government’s spending plans for the next six months. With an election imminent, traders can expect some surprises.
- Key price level: 1.25063 – 1.25167 – Resistance in the form of weekly high and 50% Fib retracement level.
USDJPY
The release of the Fed minutes on Wednesday can be expected to trigger moves in all currency pairs, and USDJPY could suffer aftershocks when the Japan CPI inflation report hits market newswires on Thursday. Analysts forecast October’s CPI number will be higher than that recorded in September.
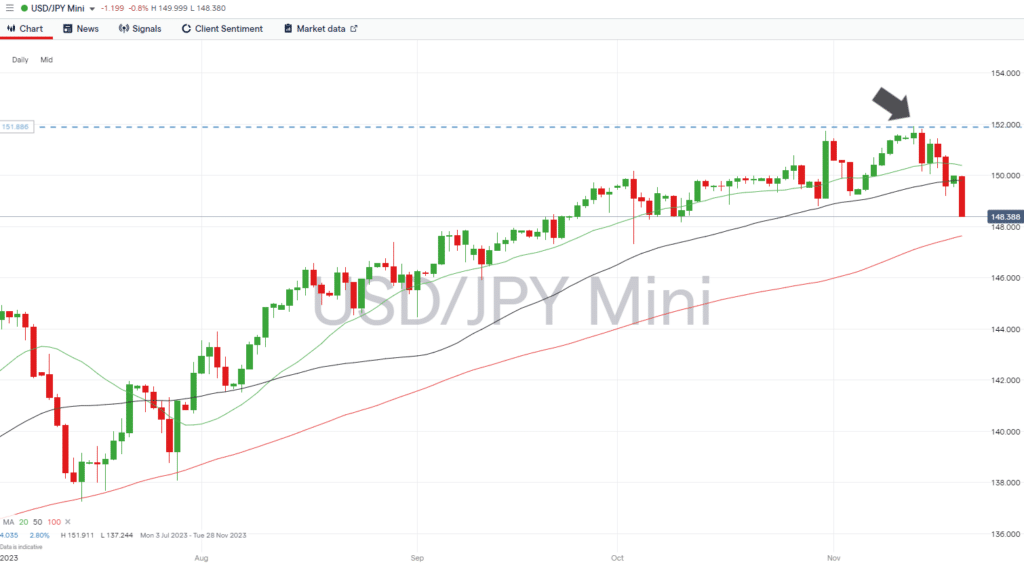
The bull run in USDJPY, which took place during 2023, has left the currency pair’s price some distance above key SMA metrics. Even a short-term retracement has room to move to the downside before hitting key support levels.
USDJPY – Daily Price Chart

Source: IG
- Key number to watch: Thursday 23rd November – Japan CPI (October) 11.30 pm (GMT) Analysts expect prices to rise 3.2% year-on-year and core CPI to rise 2.9% year-on-year, up from 2.8% last month.
- Key price level: 147.635 – Region of the 100 SMA on the Daily Price Chart.
Trade EURUSD with our top brokers:
| Broker | Features | Regulator | Platforms | Next Step | |
|---|---|---|---|---|---|
 Your capital is at risk
Founded: 2014 Your capital is at risk
Founded: 2014 |
|
FSPR | MT4 | ||
 Your capital is at risk
Founded: 2006 Your capital is at risk
Founded: 2006Europe* CFDs ar... |
|
ASIC, FSA, FSB, MiFID | MetaTrader4, Sirix, AvaOptions, AvaTrader, Mirror Trader | ||
 Between 74-89% of CFD traders lose
Founded: 2010 Between 74-89% of CFD traders lose
Founded: 2010Between 74-89 % of retail investor accounts lose money when trading CFDs |
|
ASIC, FCA | MetaTrader 4, MetaTrader 5, cTrader | ||
 Your capital is at risk
Founded: 2009, 2015, 2017 Your capital is at risk
Founded: 2009, 2015, 2017 |
|
ASIC, CySEC, IFSC | MT4 Terminal, MT4 for Mac, Web Trader, iPhone/iPad Trader, Droid Trader, Mobile Trader, MT5 | ||
 Your capital is at risk
Founded: 2006 Your capital is at risk
Founded: 2006 |
|
CySEC, DFSA, FCA, FSB, SIA | MetaTrader4, MetaTrader5, cTrader, FxPro Edge (Beta) | ||
 Your capital is at risk
Founded: 2011 Your capital is at risk
Founded: 2011 |
|
CySEC, FSC, FSCA, MISA | MT4, MT5, OctaTrader | ||
Risk Statement: Trading financial products carries a high risk to your capital, especially trading leverage products such as CFDs. They may not be suitable for everyone. Please make sure that you fully understand the risks. You should consider whether you can afford to take the risk of losing your money.