
- The US Non-Farm Payrolls unemployment report will form the cornerstone of the week’s trading activity.
- The key data from China (PMI) and Australia (interest rate decision) will also be on traders’ minds.
- The corporate calendar is quieter but there are enough key data points due out to help traders establish how long the current bull market might run.
Record gains in risk-on assets in November have left traders wondering how much further the current bull run can go. With December known for quieter market conditions and the Santa Rally phenomenon, eyes now turn to the US Non-Farm Payrolls unemployment report due this week. That report should offer an insight into the health of the jobs market in the world’s most important economy.
China’s stocks have failed to rally with the same strength as those of other major trading nations, which could be a cautionary note for those looking to go long into the rally. The Caixin PMI number due to be published on Tuesday is, therefore, a key data point, as will be the interest rate decision of the Reserve Bank of Australia, which will be announced the same day.
US Dollar
The once-a-month US Non-Farm Payrolls report, due on the first Friday of the month, is always one of the most keenly awaited news events. That will be more the case this week after the rally through November was driven by investors taking the view that the Fed might be turning hawkish on interest rates. A ‘hot’ number from the US labour market could cause some to reconsider the next steps of Jerome Powell and the rest of the FOMC. Any indication that the US unemployment rate is sticking near the current 3.9% level could renew interest in risk currencies and a move away from the security of the greenback.
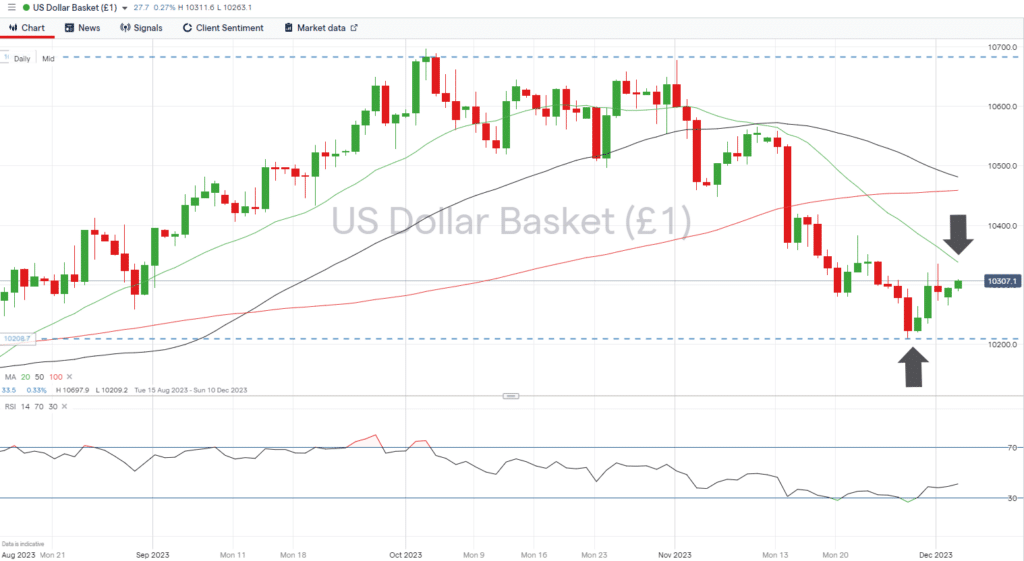
The US Dollar Basket index gave up 3.65% in value through November, but with the RSI on the Daily Price Chart at 41.2 there is still room for further price falls before the market becomes ‘oversold’ in that time frame. November’s low of 102.09 could offer support, but the path of least resistance appears to be downward until there is a confirmed break of the 20 SMA on the Daily Price Chart (103.98).
US Dollar Basket Index – Daily Price Chart – November Lows and SMA Resistance
Source: IG
Key number to watch: Friday 8th December 1.30 pm (GMT). US Non-Farm Payrolls (November) Analysts forecast payrolls to rise by 100,000 from last month’s 150,000. Unemployment rate to remain unchanged at 3.9%, and average hourly earnings to increase 0.2% month-on-month and 4% year-on-year, compared to 0.2% and 4.1% at last month’s reading.
Key price level: 102.09 – November price low recorded on 28th November.
EURUSD
A quiet week in Eurozone-specific news will see traders of euro currency pairs relying on US data reports as a guide. The NFP report on Friday is the big number to watch out for. But Tuesday’s interest rate decision by the Reserve Bank of Australia will also offer an insight into the extent to which policymakers are adopting a more aggressive approach.
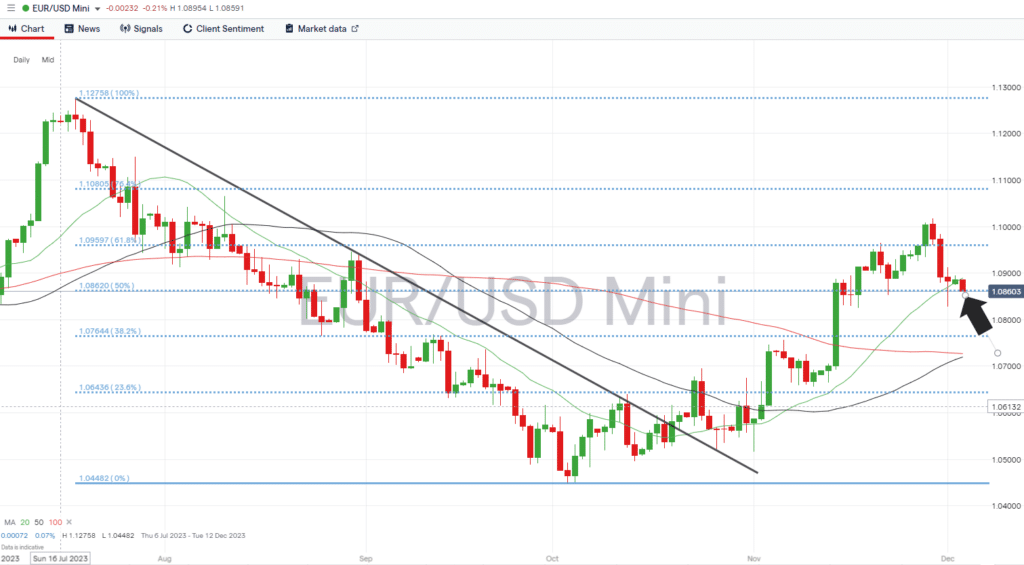
The price chart for EURUSD shows it spent some of last week testing a key resistance level to end the week trading below it. The 61.8% Fibonacci retracement level of the euro price slump between July and October sits at 1.09597. That resistance level is close enough to the psychologically important 1.1000 price bar for it to have been tested last week; however, Friday’s closing price of 1.08835 shows that Eurodollar bulls might not have things all their way. The 50% Fib at 1.08620 can be expected to offer support to EURUSD prices despite inflation news reports of last week coming in weaker than expected. That leaves room for the ECB to hold off from hiking interest rates at their next meeting.
Daily Price Chart – EURUSD – Fib retracement support/resistance levels
Source: IG
Key number to watch: Friday 8th December 1.30 pm (GMT). US Non-Farm Payrolls (November) Analysts forecast payrolls to rise by 100,000 from last month’s 150,000. Unemployment rate to remain unchanged at 3.9%, and average hourly earnings to increase 0.2% month-on-month and 4% year-on-year, compared to 0.2% and 4.1% at last month’s reading.
Key price level: 1.08620 – support formed by the 50.0% Fib retracement.
GBPUSD
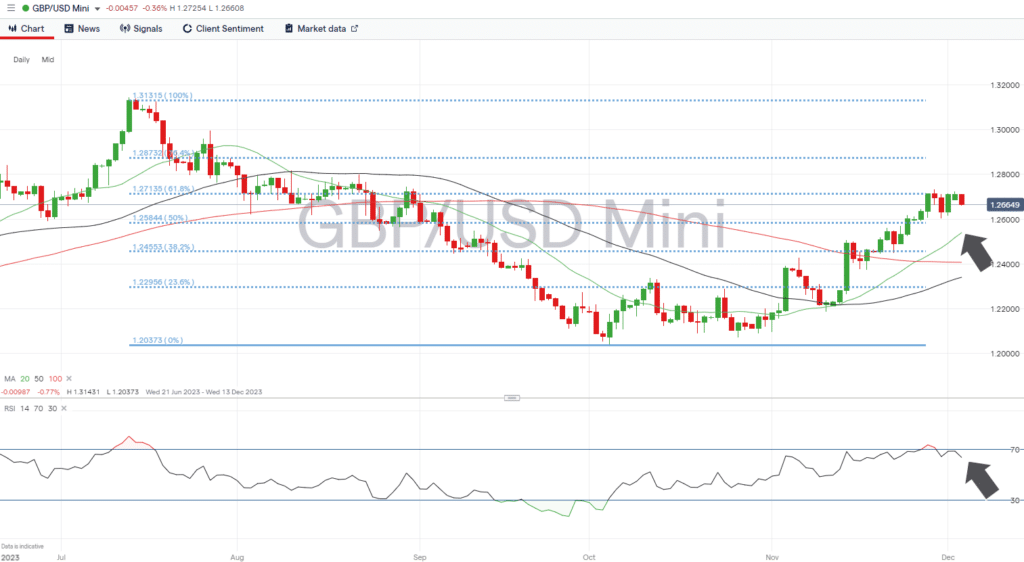
The absence of major news relating to sterling markets has allowed the price of GBPUSD to chart a steady upward trajectory over the last two weeks. Since 14th November, it has gradually pushed through the resistance levels formed by the 38.2% and 50% Fib retracement levels of the fall in price between July and October and now sits below the 61.8% Fib resistance. With price now extended from the SMAs on the Daily Price Chart and the RSI at 63.7, there is room for short-term weakness and a retracement in price that could extend as far as the 20 Daily SMA, which sits in the region of 1.25396.
Daily Price Chart – GBPUSD – Daily Price Chart – Divergence from SMAs
Source: IG
Key number to watch: Friday 8th December 1.30 pm (GMT). US Non-Farm Payrolls (November) Analysts forecast payrolls to rise by 100,000 from last month’s 150,000. Unemployment rate to remain unchanged at 3.9%, and average hourly earnings to rise 0.2% month-on-month and 4% year-on-year, compared to 0.2% and 4.1% at last month’s reading.
Key price level: 1.25844 – Support offered by the 50% Fibonacci retracement level which previously acted as resistance to upward price moves.
USDJPY
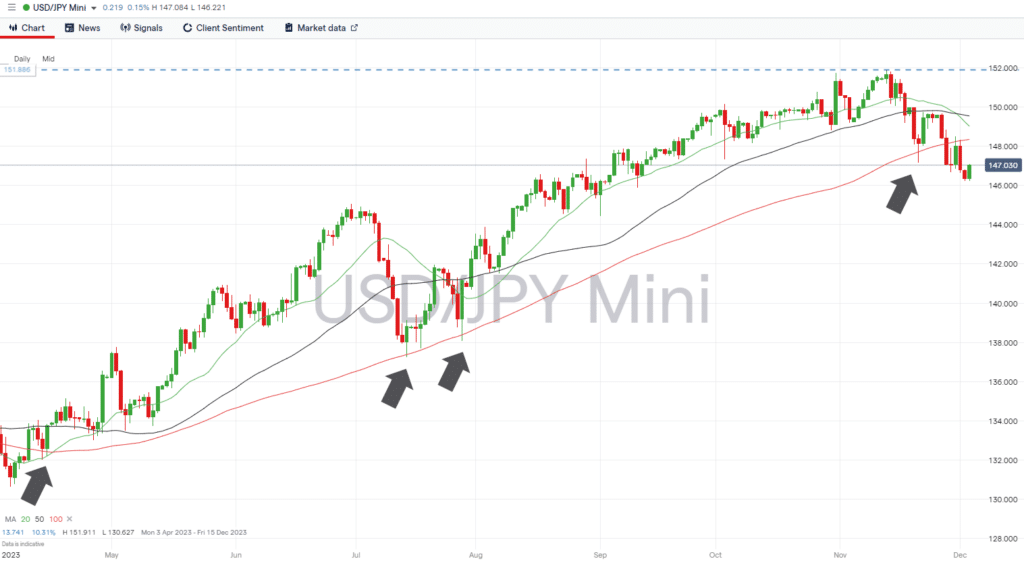
The decline in the value of USDJPY, which commenced on 14th November last week, turned into a rout. The currency pair gave up 1.77% in value on a week-to-week basis and crashed through the key metric of the 100 SMA on the Daily Price Chart, which sits in the region of 148.35. Between 16th April and last week, the price had previously tested that 100 SMA on five occasions and, on each one, failed to confirm a break below the downside. That makes Tuesday’s burst through to a closing price of 147.06 even more significant.
USDJPY – Daily Price Chart – Break of 100 SMA
Source: IG
Key number to watch: Tuesday 5th December 1.45 am (GMT) – China Caixin services PMI (November). Forecast to rise to 51.0 from 50.4.
Key price level: 148.35 – Region of the 100 SMA on the Daily Price Chart.
Trade EURUSD with our top brokers:
| Broker | Features | Regulator | Platforms | Next Step | |
|---|---|---|---|---|---|
 Your capital is at risk
Founded: 2014 Your capital is at risk
Founded: 2014 |
|
FSPR | MT4 | ||
 Your capital is at risk
Founded: 2006 Your capital is at risk
Founded: 2006Europe* CFDs ar... |
|
ASIC, FSA, FSB, MiFID | MetaTrader4, Sirix, AvaOptions, AvaTrader, Mirror Trader | ||
|
Between 74-89 % of retail investor accounts lose money when trading CFDs |
|
ASIC, FCA | MetaTrader 4, MetaTrader 5, cTrader | ||
|
|
|
ASIC, CySEC, IFSC | MT4 Terminal, MT4 for Mac, Web Trader, iPhone/iPad Trader, Droid Trader, Mobile Trader, MT5 | ||
 Your capital is at risk
Founded: 2006 Your capital is at risk
Founded: 2006 |
|
CySEC, DFSA, FCA, FSB, SIA | MetaTrader4, MetaTrader5, cTrader, FxPro Edge (Beta) | ||
|
|
|
CySEC, FSC, FSCA, MISA | MT4, MT5, OctaTrader | ||
Risk Statement: Trading financial products carries a high risk to your capital, especially trading leverage products such as CFDs. They may not be suitable for everyone. Please make sure that you fully understand the risks. You should consider whether you can afford to take the risk of losing your money.