As the investment community realigns its thinking about the reluctance of the Fed to raise interest rates only one or even two times in 2016, the proverbial half-empty glass has suddenly begun to fill of with optimistic water, once again. After five years of near disastrous results, commodities may be finally making a real comeback. The newly found optimism is not just with oil, which has inched over $49 a barrel, but also with both hard and soft commodities across the board. Whether you dig it or grow it out of the ground is not a factor. Oil, ores, precious metals, and agricultural products, from sugar to soybeans and even to fertilizers, are bouncing off bottoms and headed north.
Read more forex market news
Many analysts are so euphoric that they are claiming that commodities are offering a trading opportunity of the type that only comes along every decade or so. To these folks, it may be as easy as fishing for fish in a barrel, no pun intended. You could, of course, go long in your chosen commodity type, or, from an energy perspective, go with major producers, like BP or Shell. Mining companies may be a bit more sluggish, but if China starts to grow, then Glencore, BHP Billiton, and Rio Tinto begin to look interesting. The safest bets, however, may reside in basic commodity currency pairs, where liquidity is key and mismanagement, as with stock companies, is not an issue. The Canadian Dollar and the Norwegian Krone are good targets, and the Aussie and Kiwi are next in line.
It is a bit surprising how quickly analysts have changed their tunes, especially about oil prices. The shear number of articles that tout $100 a barrel, not $50, as the next target, is astounding. The group that follows commodities had been crying in their milk for some time, viewing recent positive trends as nothing more than the effect of a weakening U.S. Dollar. Surely recent gains would dissipate like snow in the desert once the Fed righted itself and began to get hawkish about another rate hike. The Fed did just that last week, but commodities did not blink an eye. One never knows how much weight to assign to one Fed governor over another, but hawks on the committee seem to be pushing for a June rate hike, if only to demonstrate the resoluteness of their organization.
What is the tale of the tape, as for recent moves by the commodity sector?
What is all of the euphoria about? Commodities have been trapped in a downward spiral since 2011. Many commodities hit multi-year lows during the last two quarters, but, amazingly, the vast majority of them seemed to have formed a firm bottom in February. While a subset of the analyst community attributes this good fortune to a falling USD, the Dollar has only fallen in the neighborhood 4% in 2016.
Commodity prices are quoted in USD, such that there has always been an inverse correlation with the movements of the greenback, but this time around, prices for hard and soft commodities have, as a group, bounced back multiples of that 4% figure. Even currencies like the Loonie and the Norwegian Krone have appreciated in the 7 to 11% realm.
The positive news is not only about oil. The tales of the tape in a variety of markets tell the same story. To begin with, Oil did rally from a low of $26 in February to a current price of $49 today, a hefty 88% rise. What happened in other markets? Here is a brief summary of escalating price points:
Iron Ore: The steel market is humming again, as iron ore rose from $33 a ton in January to a peak of $60, only to pull back to the $50 range in May.
Copper: The bellwether of economic activity has also risen of late, from $1.94 to $2.30 a pound, settling back at $2.06 after a brief round of profit taking.
Gold: The yellow metal had been languishing around $1,046 an ounce in late 2015, only to jump to a high of $1,306 in early May. It has since pulled back to the $1,253 range.
Soybeans: Prices for the staple agricultural product have recently soared from $8.49 a bushel to $10.88 last week.
Sugar: Prices hit a long-term low last August of $0.10 per pound. Since that bottom, it has formed higher highs and higher lows to rest now at 17 cents.
Volatility has returned to the world of commodity prices, and the ripple effects in this market sector are quickly spreading to complementary arenas. Fertilizer demand is up, as is demand for agricultural equipment. Companies in these industries and in mining enterprises are beginning to entice investors. As money losers for quite some time, most of the group has resorted to paying high dividends to retain loyalty amongst its various shareholders. The time is now ripe, according to the optimists, to benefit from not only high dividend income streams, but also from material equity appreciation, as well.
What has convinced analysts that a bottom has formed in commodity process?
The search for the leading indicator that would signify a true, rather than a false, bottom in commodity prices has been ongoing for some time. The following chart comes courtesy of Bloomberg and, for all intents and purposes, it has won our “Chart-of-the-Week” contest:
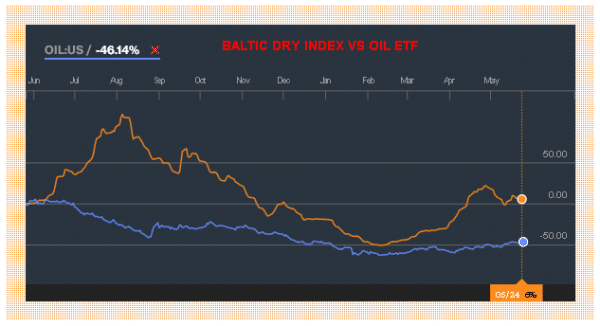
Has anyone out there ever heard of the Baltic Dry Index (BDI)? Per one analyst, “The BDI is a measure of shipping rates for dry bulk cargoes of raw materials. On February 10, it hit all-time lows at 290 and by April 27 it had increased to 715 – an increase of over 146% in just nine weeks. As of last Friday, the index was at the 634 level, still over 118% higher than the mid-February lows. This index is an excellent measure of global shipping activity and its rise from the lows is a good indication that demand for commodities has picked up over recent months.”
The chart above takes the BDI and compares it to oil prices over the past year. Both the BDI and Oil hit bottom in mid-February, but the BDI has fully recovered lost ground for the year. The broadening gap between the two lines is an indication that a broader-based recovery is taking place regarding general industrial and agricultural resources, a harbinger of better times to come. The BDI serves as a leading indicator for the commodity’s industry, in much the same way that economists look to activity at UPS and FedEx as a good barometer for new trends in other business sectors.
Is everyone onboard with this new way of thinking?
This question is obviously of a rhetorical nature. There will always be naysayers that try to rain on the parade of optimistic analysts. In this case, perhaps one in three are highlighting the negative sides of the equation. They first point to the U.S. Dollar and claim that the Fed will act in June, thereby shooting a big hole in the rally of commodities. Speculators in oil prices are also dictating the shape of the future, if one believes what is transpiring within “Commitment of Traders” reported data. While open interest information reveals that short positions still outnumber longs by nearly 12 to one, the cumulative impact of changes over the past few months, when compared to the futures market, is eye opening:
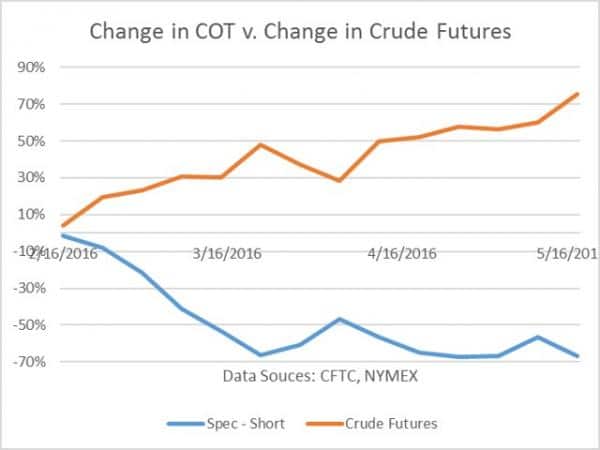
The chart actually looks as if it could support the opposing argument, but accumulated short position reversals have leveled off in this diagram. Crude futures have not. If you take the negative argument for what it is worth, then you accept that markets top out when bullish news begins to subside. These analysts believe that things will come unglued at the $50 level. Shorts will return in droves, driving the price back down to the $40 level, before it resumes its favorable long-term trend.
The negative group also likes to point to natural gas, one area that supports their basic hypothesis. It, too, hit bottom in late-February and early-March, but, from that point forward, it has been stuck in a tight range. Seasonal issues may be the culprits with natural gas. There is usually a lull in demand in the Spring, before things heat up down the line. Speculators understand this relationship and tend to pile on the short positions. A short squeeze may be in the cards at some point, but it can be a costly proposition for longs at this stage.
What fundamentals are improving the supply side situation for oil?
The recent run up in oil prices has been impressive for one single reason – it has been a gradual stair-stepping affair, no explosions, no wild gyrations, and no falling off a precipice. As analysts have noted from time to time about commodities, “Commodities tend to take the stairs up and the elevator down”, but where was the elevator last week? The Fed minutes came out hawkish in favor of a June rate hike, but one observer was quick to note that, “Oil seems to have shrugged it off, which is a sign that market fundamentals have shifted.”
What fundamentals have shifted? The word for months is that something had to happen on the supply side to end the inventoried glut now maintained at capacity in the world’s storage facilities. One piece of news is that oilrigs in the U.S. have stabilized at 318, a far cry from a peak of 1,600, but a good bit less than 543 this time last year. Wildfires
have cut into Canadian production, and severe political and economic problems have stalled efforts in Venezuela and Nigeria. Russia is cutting back, as well, for taxation reasons, but Iran and other OPEC countries are picking up some of the slack. Demand is also improving in the U.S., China, and the rest of Asia, a sign that new fundamentals are beginning to take hold.
Concluding Remarks
Have commodities, after five dismal years, finally formed a permanent bottom and established the first leg of a positive, favorable, long-term trend? There are arguments on both sides, but this is the first time where optimists on the street seem to handily outnumber opposing forces. The odds may be more like “70/30” for now, but veteran traders know from experience that it is foolhardy to predict bottoms in any market. As long as higher highs are followed by higher lows and then higher highs again, after profit taking has run its course, then perhaps we can all agree that a reversal has occurred. For the time being, be cautious, and protect against downside risk.
 Your capital is at risk
  Your capital is at risk