
The comparative price moves over the last week in Bitcoin and crude oil indicate that the energy commodity and not the crypto is the market where things are happening.
That might not cause a stampede from crypto markets into oil trades as holding crypto is, for many, a long-term proposition. However, it is possible that spare cash continues to find its way into the oil market as the upward price trend continues to attract speculators.
| Instrument | 08-Mar | 01-Mar | Price change | % Change | ||||
| Crude Oil WTI | 66.57 | 62.40 | 4.17 | 6.68% | ||||
| Bitcoin | 49,657 | 47,165 | 2,492 | 5.28% | ||||
Source: Forex Traders
Oil (WTI) – Weekly Price Chart – Volumes
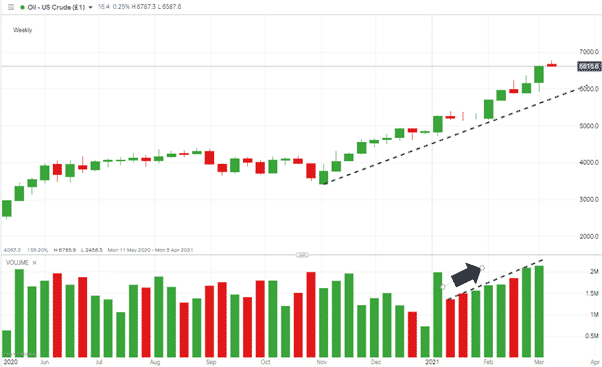
Source: IG
The oil price has firmed up and so have trading volumes. It’s hard to tell if this is genuine demand from users of oil – a bullish sign for the entire global economy – or an indication that speculators have detected a chance to make short-term profits. Five of the last six weeks have seen the amount of trading exceed that of the previous seven days.
Oil rallies thanks to OPEC+
The 93% price rise in oil since November the 1st, 2020, is due to OPEC+ managing to impose and hold supply restrictions. Even as the global economy pulls out of its pandemic-driven slump, the producers are holding their nerve.
The discipline of OPEC+ is as impressive as it is unusual. Analysts had priced in last week’s OPEC meeting as not going as smoothly as it did, and with the next OPEC summit not due until the 31st of March, there are several weeks for oil to try to break the $70 level.
How Far Can the Oil Price Rise Go?
There are reasons that the oil price could at current levels look overbought and due for a correction. Most of them are based on technical rather than fundamental analysis.
Oil (WTI) – Weekly Price Chart – RSI & Averages
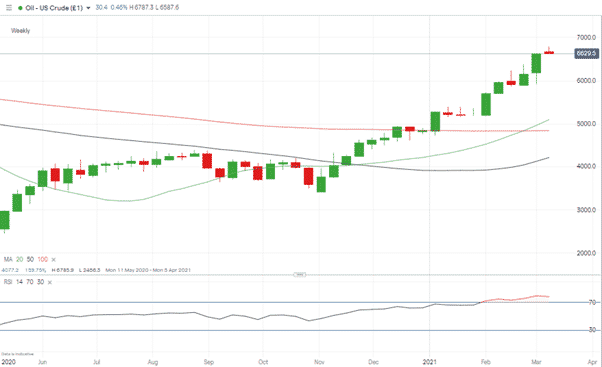
Source: IG
- On a weekly time-scale, oil has been trading above 70 RSI since the beginning of February.
- The bullish indicator of the 20 SMA intersecting the 100 SMA doesn’t outweigh the argument that price is a long way from all the major SMA’s, which on a weekly basis are still closer to $50.
- This inverse correlation between the US dollar and commodities is a general rule and the correlation isn’t perfect. However, it is something that needs to be factored in, specifically the USD Basket index daily-chart reporting a break of its long-term downward trend.
USD Basket index – Daily Price Chart – Breakout
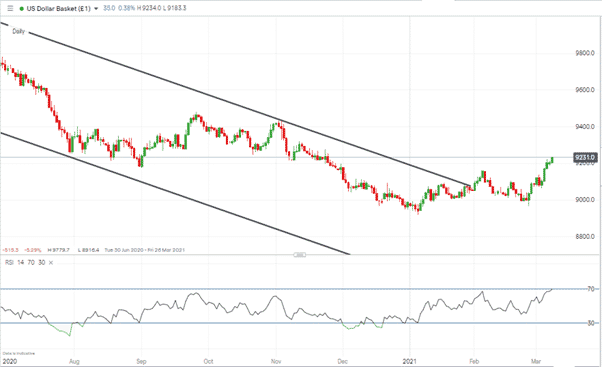
Source: IG
The price of oil has historically tended to drop when the dollar strengthens against other major currencies. That makes the USD Basket the indicator which might point to the current oil bull run coming to an end.
Oil Fundamental vs Technical Analysis
It appears that the oil market is bracing itself for a classic clash between Technical and Fundamental Analysis. Those buying based on fundamental analysis have continued to see a positive return on their investment for days and weeks. Price does tend to revert to mean, but the more difficult question to answer is when that is likely to happen.
If you want to know more about this topic, please contact us at [email protected]
 Your capital is at risk
  Your capital is at risk