An interestingly hesitant start to the trading week has prompted a rapid reassessment of where markets may be heading next. Stocks on Wall Street reached new highs last week, but on the back of disappointing news out of Asia, the US and European stock futures are underwater, and the Japan Nikkei is down more than two per cent.
The “record highs” news story has been running for weeks, so the obvious question is whether this is a dip to buy or a sign that the wheels are (finally) coming off.
| Instrument | 9th Aug | 16th Aug | Hourly | Daily | % Change |
| GBP/USD | 1.3881 | 1.3848 | Strong Sell | Strong Sell | -0.24% |
| EUR/USD | 1.1763 | 1.1787 | Neutral | Sell | 0.20% |
| FTSE 100 | 7,100 | 7,162 | Strong Buy | Strong Buy | 0.87% |
| S&P 500 | 4,424 | 4,453 | Strong Buy | Strong Buy | 0.66% |
| Gold | 1,745 | 1,773 | Sell | Neutral | 1.60% |
| Silver | 2,396 | 2,354 | Strong Sell | Strong Sell | -1.75% |
| Crude Oil WTI | 66.44 | 67.03 | Strong Sell | Strong Sell | 0.89% |
| Bitcoin | 43,270 | 47,340 | Buy | Buy | 9.41% |
Source: Forex Traders Technical Analysis
The spoiler alert is that the former option remains most likely, at least in the short term. On a week-on-week basis, all major equity indices remain in positive territory despite Monday morning’s pullback. The FTSE 100 is up by almost one per cent and continues to attract attention from international investors trading off it because it is lagging behind its peer group. Oil, gold, and bitcoin are all up as well. The technical indicators and price action acting as a reminder of the need to look beyond the headlines.
Is Now the Time to Buy Stocks?
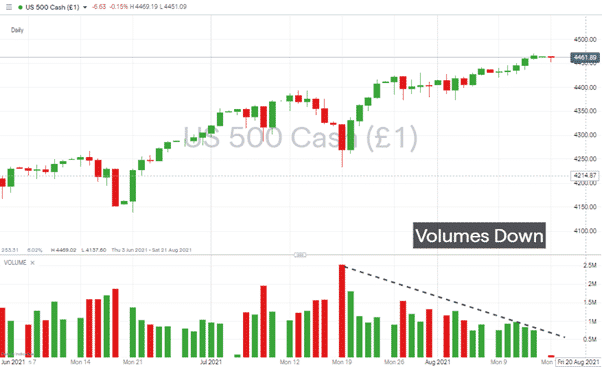
August markets are notoriously docile and characterised by lower trading volumes and fewer determined shifts in direction. Even the ‘rainmakers’ need a break some time. The Covid pandemic turned everything upside down, and other seasonal patterns such as “Sell in May” have not been as effective or reliable due to the underlying fundamental realignment.
Trading patterns over the summer holidays suggests this one historical pattern has come into play, which might not be too surprising given the pandemic started 18 months ago. The good news that ‘normality’ has returned to the markets suggests Monday’s sell-off is temporary. The not so good news is that the pick-up in trading volumes in September and October is associated with another trend.

Source: IG
One research tool to try is Googling “Why do markets crash in …” and find that the search engines algorithms predict “…October” to be the word you’re looking for. The “October Effect” has been the scourge of investors for more than 100 years. The Bank Panic of 1907, the Stock Market Crash of 1929, and Black Monday 1987 all happened during October. Things change, and old rules start not to apply, but the follow-up punch is that historically speaking, September has had more down months than October, just not the major crashes associated with the later month.
Medium and long-term investors could face a situation where it is too late to buy and too early to sell.
If you want to know more about this topic, please contact us at [email protected]
 Between 74-89% of CFD traders lose
  Your capital is at risk
  77% of CFD traders lose
  Your capital is at risk
  Your capital is at risk