
Last week’s inflationary scare has resulted in a significant uptick in price volatility. The CPI report out of the US revealed that US consumer prices in April increased at the highest rate for 12 years. As identified in this report, the CPI report was spooking the markets even before it was released. Tuesday the 11th of May saw the Dow Jones Industrial Average record its worst daily performance since February. By Friday’s close, the same index had reported its worst weekly performance over that same period.
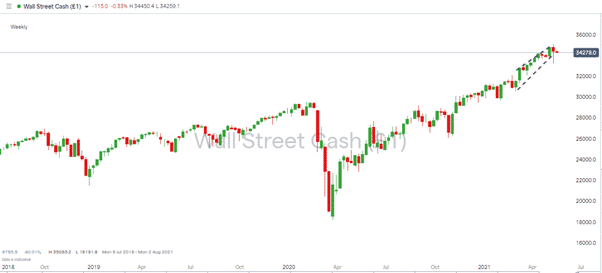
The large number of headlines referencing “since February” need to be considered. For several months volatility has been low in all markets as cheap money from central banks and governments has flowed into the markets.
Source: IG
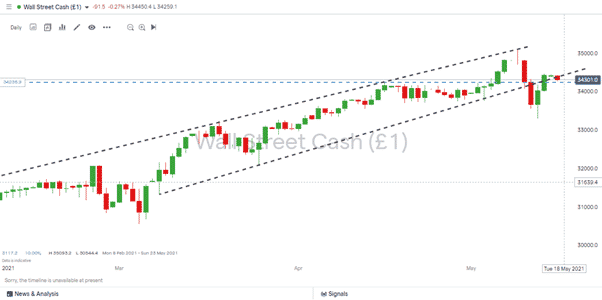
When viewed on a longer-term time frame, that tight trading range looks like a breakout waiting to happen.
Source: IG
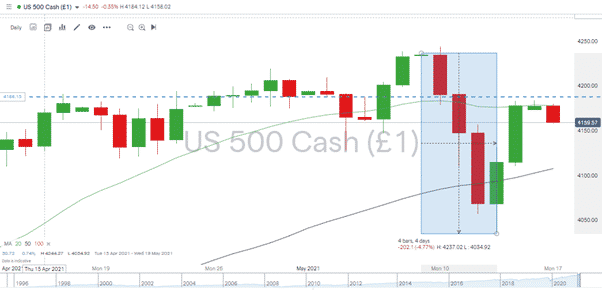
Weekly Vol is low but Daily Vol is High
If you only glanced at the weekly snapshot of prices across the major asset groups, you’d have missed the dip and bounce. The S&P 500 is down 1.51% week-on-week, but the price range was closer to 5% over the five days.
| Instrument | 10th May | 17th May | Hourly | Daily | % Change | |
| GBP/USD | 1.4055 | 1.4118 | Neutral | Strong Buy | 0.45% | |
| EUR/USD | 1.2153 | 1.2145 | Neutral | Strong Buy | -0.07% | |
| FTSE 100 | 7,155 | 7,061 | Strong Buy | Strong Buy | -1.31% | |
| S&P 500 | 4,237 | 4,173 | Strong Buy | Buy | -1.51% | |
| Gold | 1,837 | 1,853 | Strong Buy | Strong Buy | 0.87% | |
| Silver | 2,774 | 2,770 | Strong Buy | Strong Buy | -0.14% | |
| Crude Oil WTI | 65.39 | 65.44 | Neutral | Strong Buy | 0.08% | |
| Bitcoin | 59,045 | 44,601 | Sell | Strong Sell | -24.46% |
Source: Forex Traders Technical Analysis
Source: IG
Equity indices have flirted with the idea of “Sell in May”, and most global benchmarks are in the red for the month, but the bears aren’t having things all their own way. The resistance levels are holding, but prices are consolidating and finding support on moving averages which are catching up with the recent rally. If the markets follow the same route they’ve taken for much of the past decade, this points to wedge patterns forming over the next week. The alternative is the uptick in volatility continuing to build. It’s something of a guessing game as so much comes down to the comments of central bankers, particularly those holding office at the US Federal Reserve.
Wednesday’s price crash in the equity markets was an easily identifiable dip-buying opportunity, but the bulls only got involved after the Fed calmed market nerves. The view from Jerome Powell and his team is that the inflationary pressure continues to be “transitory” and, if not planned for, at least predicted.
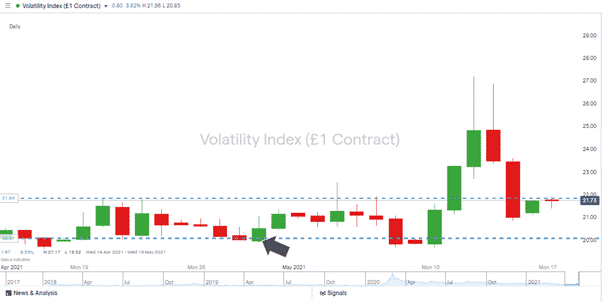
Back on the 29th of April, the VIX index was tipped by Forex Traders analysts as being unrealistically low, and the 20.00 price level continues to prove a reliable support. The re-testing of the 20.00 price level between the 7th and the 9th of May would have closed out anyone with stop-losses too close to their entry point. The VIX price spiked as high as 27.00 on the back of the inflation report, but the fall back to 21.73 points to investors’ willingness to take the Fed’s comments at face value.
Source: IG
If you want to know more about this topic, please contact us at [email protected]
 Your capital is at risk
  Your capital is at risk