
FOCUS ON: Bearish Undertones And Jackson Hole Symposium
- Risk-off sentiment returns to the markets
- Fundamental price drivers continue to point to a divergence between GBP, EUR, and USD
- This week’s Jackson Hole Symposium is looking like an increasingly important guide to the next market move
After several weeks of strengthening ‘risk-on’ appetite, the third week of August was marked by a significant re-think by traders. Looking beyond the relief rally formed by markets being ‘oversold’ in the short-term, investor decisions once again reflected the risk of the global economy tipping into a period of stagflation.
Yen, sterling, and the euro all gave up more than 2% of value against the US dollar. That is a significant enough move in percentage terms, but more significantly, took major currency pairs through psychologically important trade levels. GBPUSD is now trading below the important 1.20 price bar, EURUSD is heading towards 1.0 and euro trading is at parity with the dollar.
The shift is based on long-running fundamental analysis factors being given more prominence. With each week that passes and eurozone economies, most notably Germany, failing to resolve their dependence on Russian energy supplies, there is an increased likelihood of economic activity in those countries being hit by electricity blackouts in the winter. The UK’s election of the next prime minister is ongoing. That leaves the government rudderless at a time when it still has to deal with legacy issues relating to Brexit.
US Dollar Basket Chart – Daily Candles – Back Inside the Long-term Price Channel
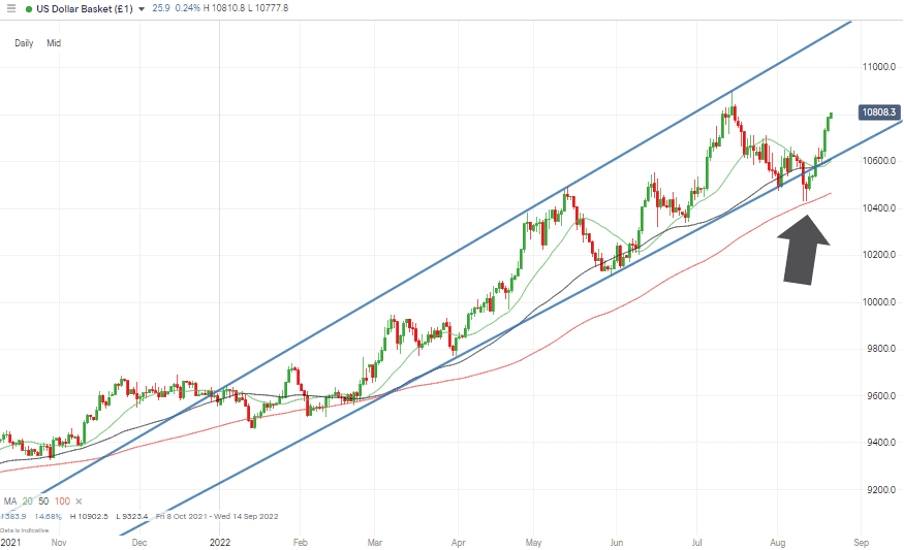
Source: IG
Important news announcements are due on Tuesday and Thursday of the coming week. Flash PMIs are due from the US, UK and eurozone on 23rd August, and finalised US GDP numbers will be released on Thursday. These data points offer every chance for stagflation to become the buzzword of trading desks worldwide. That will set an uncomfortable backdrop for the meeting of the world’s central bankers at the Jackson Hole Economic Policy Symposium on Thursday and Friday of this week.
Instrument | Price | Hourly | Daily |
EUR/USD | 1.0019 | Strong Sell | Strong Sell |
GBP/USD | 1.1810 | Strong Sell | Strong Sell |
USD/JPY | 136.79 | Sell | Strong Sell |
S&P 500 | 4,204 | Strong Sell | Strong Buy |
NASDAQ 100 | 13,149 | Strong Sell | Neutral |
FTSE100 | 7,533 | Neutral | Strong Buy |
Gold | 1,739 | Strong Sell | Strong Sell |
Crude Oil WTI | 88.76 | Strong Sell | Strong Sell |
Bitcoin | 21,270 | Strong Sell | Strong Sell |
Ethereum | 1,581 | Strong Sell | Strong Sell |
UTC: 08:22
Our trading signal analysis is based on a comprehensive summary of market data. We use a range of metrics with weighting given to simple and exponential moving averages and key technical indicators.
We created this Weekly Tips section to share possible trade entry and exit points based on our technical analysis. We also have other methods to validate our trades which we can’t publicly share that help to increase their success. All our trades include entry and at least one target price. Stop losses are applied at the reader’s discretion. Our strategies typically trade with a wide stop loss, and risk is further mitigated by trading in small sizes.
Forex
GBPUSD
The all-important Consumer Price Index (CPI) data released on Wednesday 17th August, made grim reading for sterling. Headline inflation exceeded analyst expectations and moved into double figures (10.1%). The guidance offered by the Bank of England points to price rises continuing to build momentum in the short term, indicating interest rate hikes are on the way.
The promise of more determined action by the Bank only provided short-term support for the price of GBPUSD. By the end of the week, it had broken out of a weeklong sideways trading pattern and was trading below the critical 1.20 price level. With 1.20 now acting as resistance to upward price moves rather than support, the path of least resistance still appears to be downward.
Much will depend on the announcements made at the Jackson Hole Symposium later this week. However, minutes of the last meeting of the US Federal Reserve established that interest rate policy guidance is still pointing towards more rate hikes in the US.
GBPUSD Chart – Daily Candles – No New Swing-High & Price Fall
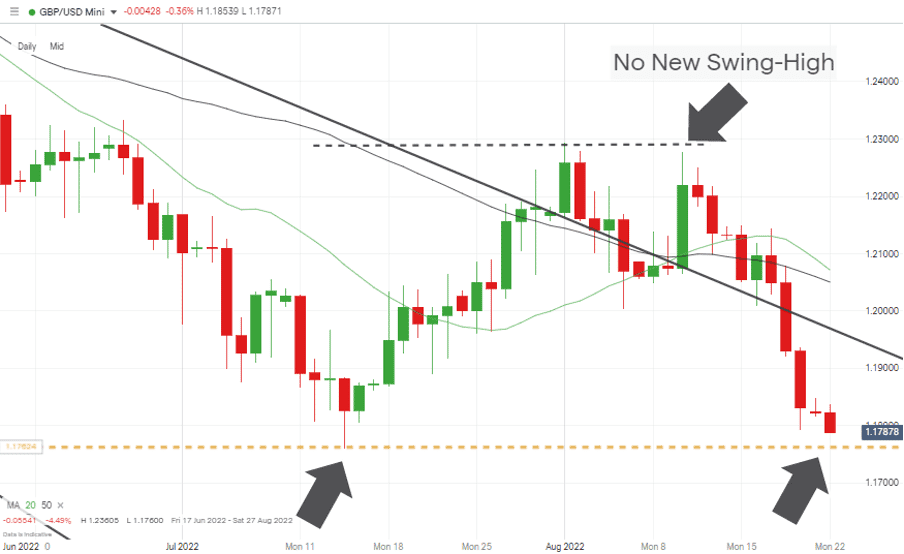
Source: IG
The inability of GBPUSD to make a new swing-high on 10th August 2022 was noted in the Technical Analysis and Trading Ideas Report as a sign the GBP could be about to roll over. That move did come about, and with price trading below key moving averages on the Daily Price Chart, the 1.176 price low of 14th July is now firmly in play.
GBPUSD Chart – Hourly Candles – Bearish Price Action
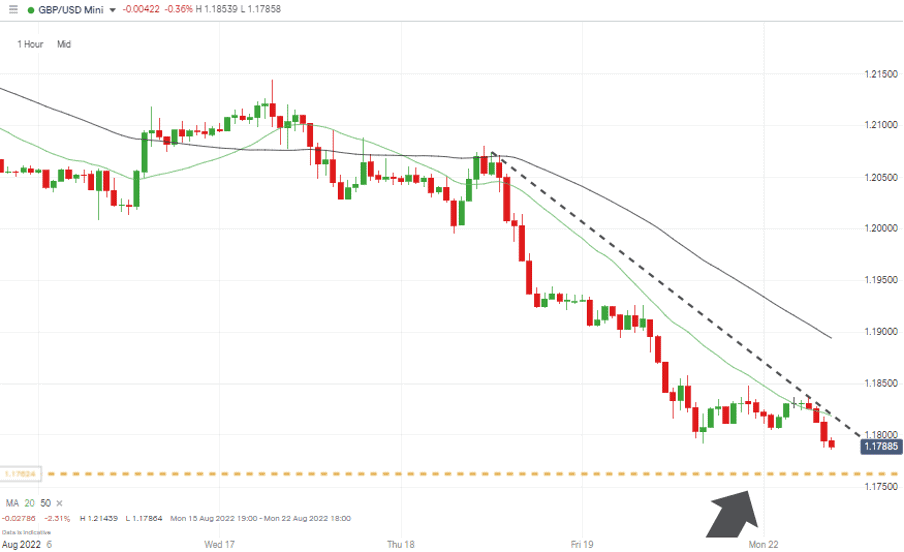
Source: IG
With price already on a downward roll, traders looking to add short positions face the question of whether to wait until the 1.176 support level is tested before going ahead. Assuming that at least a kiss of that level is inevitable opens the door to a scalping-style opportunity. Still, a break of the level would suggest that a longer-term breakout strategy needs to be applied.
Short positions
- Entry Level 1: 1.1873 – Region of a short-term downward trendline. Scalping strategy.
- Price Target 1: 1.1760 – Year to date price low of 14th July 2022. Assuming price will touch that key support during the current downtrend.
- Stop Loss: > 1.1853 – Region of the 100 SMA on the Hourly Price Chart.
- Entry Level 2: 1.1760 – Year to date price low of 14th July 2022. Breakout strategy.
- Price Target 2: 1.14098 – Price low of March 2020.
- Stop Loss: > 1.2058 – Region of the 50 SMA on the Daily Price Chart and above the ‘big-number’ price resistance level of 1.20, which could be tested during a relief rally.
Long positions
- Entry Level 1: 1.1760 – Using the July and year-to-date low as a trigger point of a potential bounce.
- Price Target 1: 1.1873 – Region of short-term downward trendline which will offer resistance.
- Price Target 2: 1.20 – Psychologically important price level.
- Stop Loss: < 1.1760 – Stops set close to 1.1760 as a move below would take GBPUSD into relatively uncharted territory with a lot of potential further downwards price movement.
Also Read: GBPUSD Forecast and Live Chart
Related Articles
- What Are Major Forex Pairs?
- What Are Minor Forex Pairs?
- USDJPY Forecast and Live Chart
- EURGBP Forecast and Live Chart
- AUDCAD Forecast and Live Chart
EURUSD
Tuesday’s PMI numbers are the big news announcement for EURUSD traders. Sentiment among manufacturers is notoriously hard to forecast. It could be swayed by the potential for an energy crisis to play havoc with the eurozone economy as winter plans are being drawn up.
EURUSD Chart – Daily Candles – Long-term Downtrend
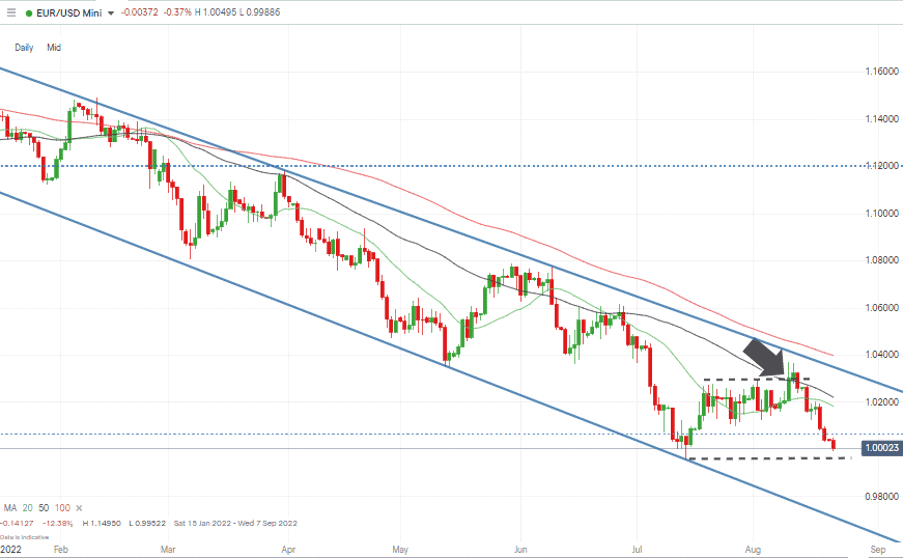
Source: IG
As with GBPUSD, the recent downward move has taken EURUSD to levels where a test of the July and year-to-date lows looks more likely than not. The same dilemma applies to Eurodollar traders. They have to decide how best to enter into short positions given the downward trend is confirmed but that there is potential for that price level to provide resistance.
EURUSD Chart – Daily Candles – Approaching July Lows
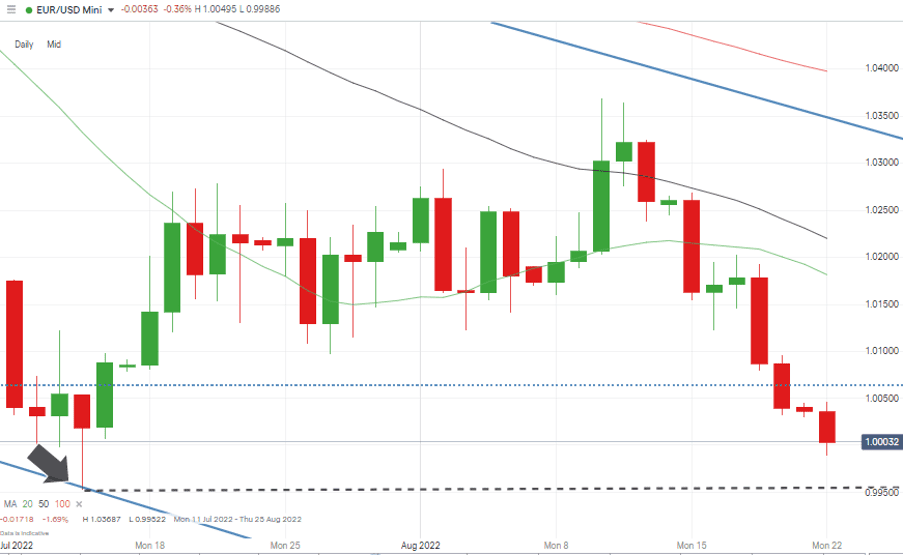
Source: IG
Short positions
- Entry Level 1: 1.00320 – Region of 20 SMA on the Hourly Price Chart. Scalping Strategy.
- Price Target 1: 1.0000 – Parity price level and hugely important price level.
- Entry Level 2: 1.0000 – Applying a breakout strategy based on eurodollar forex rates inverting.
- Price Target 2: Open-ended. EURUSD hasn’t traded below 1.000 since November 2002.
- Stop Loss: > 1.01815 – Region of the 20 SMA on the Daily Price Chart.
Long positions
- Entry Level 1: 1.0000 – Anticipating buying pressure at the significant parity price level.
- Price Target 1: 1.01602 – 50% Fibonacci retracement of the price rally from 14th July to 10th August 2022.
- Stop Loss: < 1.0000 – Psychologically important price level.
Indices
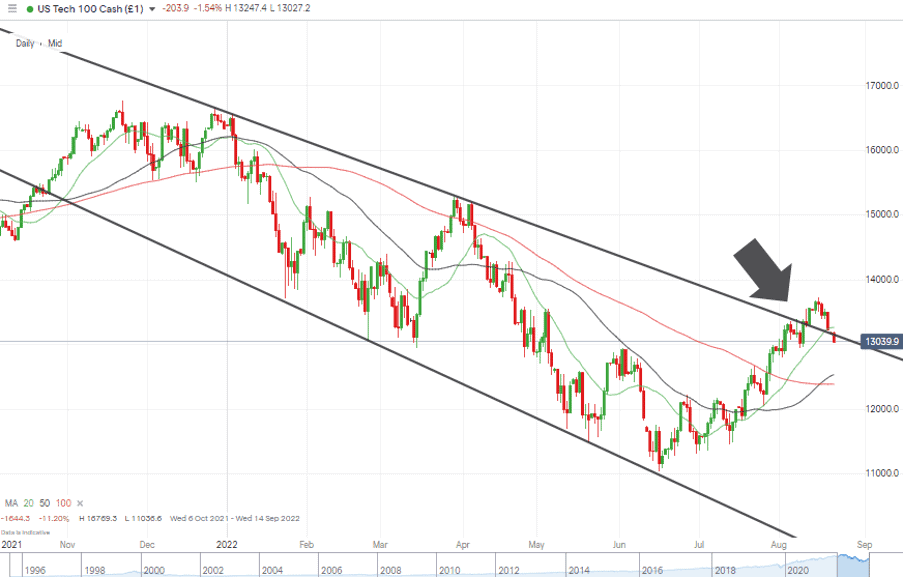
NASDAQ 100
The earnings season for Q2 2022 still has some way to run, but the major bellwether stocks have all reported. There has been a mixed bag of earnings beats and earnings misses for analysts to ponder. Bullish sentiment based on some positive numbers was supported by stocks being oversold on a short-term basis.
The break of the multi-month downward trendline on 11th August has been followed by a pullback to kiss that support/resistance line. Traders are faced with the genuine and continuing risk of an economic slowdown or a severe case of FOMO if the recent rally is a sign of the equity markets bottoming out.
NASDAQ 100 Chart – Daily Candles – Trendline Break & Return
Source: IG
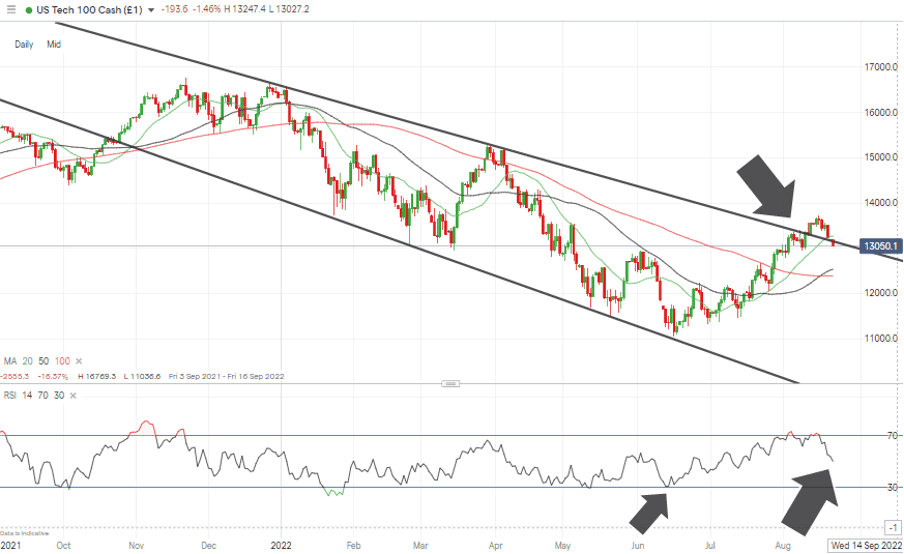
The RSI on the Daily Price Chart is currently trading at 50.22, so it offers few clues as to whether the market is oversold or overbought. That uncertainty could result in a period of price consolidation during the first part of the week. Still, events at Jackson Hole can be expected to indicate the direction of the next move.
NASDAQ 100 Chart – Daily Candles – RSI = 50
Source: IG
Long positions
Entry Level 1: 12,534 – Applying patience and waiting for price to fall back to the 50 SMA on the Daily Price Chart would reduce the risk of falling into a bear trap. That metric was an effective price guide during the sell-off in June and could be the level at which big institutional investors step in to buy undervalued stocks.
Long positions
- Entry Level 1: 12,534 – Region of the 50 SMA on the Daily Price Chart.
- Price Target 1: 14,000 – Round number resistance and just below the 20 SMA on the Monthly Price Chart (14,094).
- Stop Loss: < 12,386 – Region of the 100 SMA on the Daily Price Chart.
Short positions
- Entry Level 1: 13,166 – Region of the downward trendline dating back to December 2021.
- Price Target 1: 12,534 – Region of the 50 SMA on the Daily Price Chart.
- Stop Loss: >14,000 – Round number resistance and region of the 20 SMA on the Monthly Price Chart.
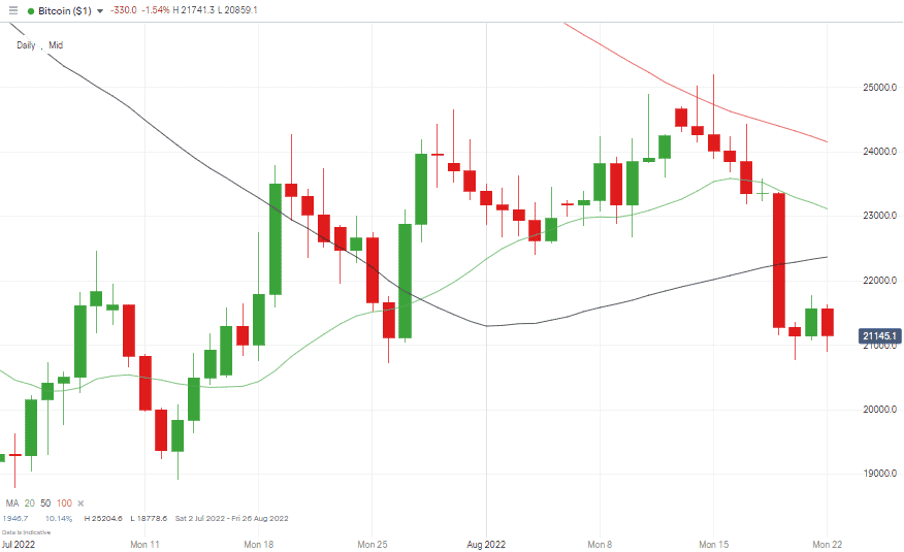
Crypto – Bitcoin & Ethereum
Weeks of strength in crypto prices were followed by a slump last week, with ether giving up 16.9% of value and bitcoin 12.2%. Bitcoin has moved from testing the 100 SMA on the Daily Price Chart to trading below the 50 and 20 SMAs, indicating that further downward price movement could be likely.
Ether’s recent price fall has taken the price of that coin to trade just above key support levels – the 50 and 100 SMAs on the Daily Price Chart. The convergence of these two key metrics in the region of $1,550 offers a buying opportunity for those who missed out on phase 1 of the recent rally, which is based on the prospects of Ethereum 2.0, and The Merge finally being rolled out to users.
Bitcoin Price Chart – Daily Candles – Sell Off and Move Through SMAs
Source: IG
Bitcoin Long positions
- Entry Level 1: 21,893 – Region of 50 SMA on Monthly Price Chart. Buying into price strength.
- Price Target 1: 25,204 – Price high of 15th August 2022.
- Price Target 2: 28,556 – Region of price support, now turned resistance which guided price during May.
- Stop Losses: < 19,263 – Region of the 76.4% Fibonacci retracement which dates back to March 2020.
Also Read: BTCUSD Forecast and Live Chart
Ethereum
Ethereum Chart – Daily Candles – Consolidation at Key SMAs
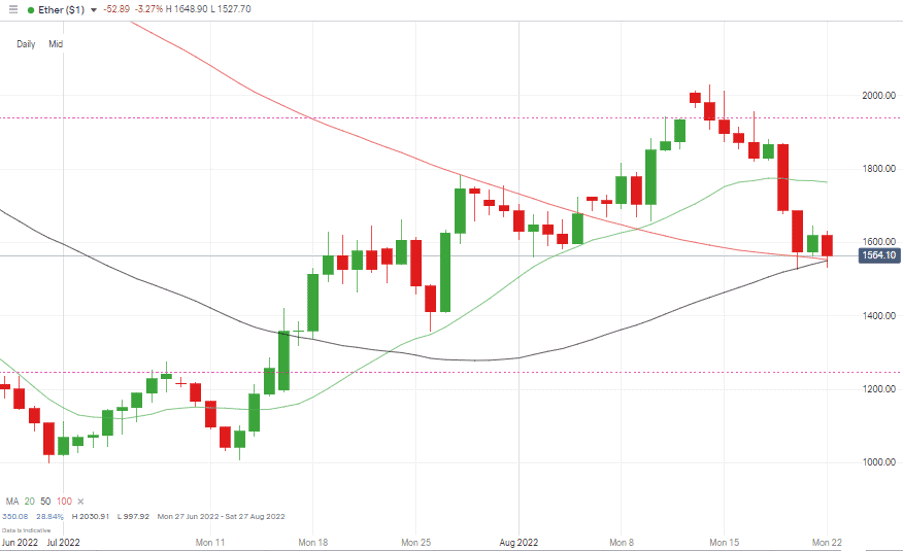
Source: IG
Ethereum Long positions
- Entry Level 1: 1,550– Region of both the 50 and 100 SMAs on the Daily Price Chart.
- Price Target 1: 1,938 – Fibonacci Retracement resistance level and close to psychologically important 2,000 price level, which was clipped earlier in August.
- Stop Losses: < 1,356 – Price low of 26th July 2022 and below the round number price level of $1,400
Risk Statement: Trading financial products carries a high risk to your capital, especially trading leverage products such as CFDs. They may not be suitable for everyone. Please make sure that you fully understand the risks. You should consider whether you can afford to take the risk of losing your money.

Forextraders' Broker of the Month
BlackBull Markets is a reliable and well-respected trading platform that provides its customers with high-quality access to a wide range of asset groups. The broker is headquartered in New Zealand which explains why it has flown under the radar for a few years but it is a great broker that is now building a global following. The BlackBull Markets site is intuitive and easy to use, making it an ideal choice for beginners.