FOCUS ON: Debt Ceiling Dictates Market Sentiment
- Markets respond positively to last week’s huge data dump.
- But US Federal debt ceiling casts a shadow over the markets.
- Price volatility could increase significantly as updates leak out of Washington.
Trading Ideas
We created this Weekly Tips section to share possible trade entry and exit points based on our technical analysis. We also have other methods to validate our trades which we can’t publicly share that help to increase their success. All our trades include entry and at least one target price. Stop losses are applied at the reader’s discretion. Our strategies typically trade with a wide stop loss, and risk is further mitigated by trading in small size.
Instrument | Price | Hourly | Daily |
GBP/USD | 1.2479 | Buy | Neutral |
EUR/USD | 1.0870 | Buy | Strong Sell |
USD/JPY | 135.85 | Strong Buy | Strong Buy |
S&P 500 | 4,137 | Neutral | Buy |
NASDAQ 100 | 13,377 | Strong Buy | Strong Buy |
FTSE100 | 7,773 | Strong Buy | Neutral |
Gold | 2,018 | Strong Buy | Neutral |
Crude Oil WTI | 69.76 | Strong Sell | Strong Sell |
Bitcoin | 26,404 | Strong Sell | Strong Sell |
Ethereum | 1,785 | Strong Sell | Sell |
UTC: 09:26
US Dollar Basket Index (DXY)
The US Dollar Basket Index has broken out of a multi-month wedge pattern. The break to the upside marks a reversal of a trend dating back to October 2022. The dollar will need to trade above the trendline for some more sessions before analysts are convinced the breakout is confirmed.
Dollar strength has surprised many. The US debt ceiling debate is still unresolved and could see Federal bodies unable to make social security payments, pay salaries, or even default on loans. That would diminish the reputation of the dollar as a safe-haven asset and likely lead to a fall in value.
US Dollar Basket Chart – Daily Price Chart – Break Out of Descending Wedge Pattern
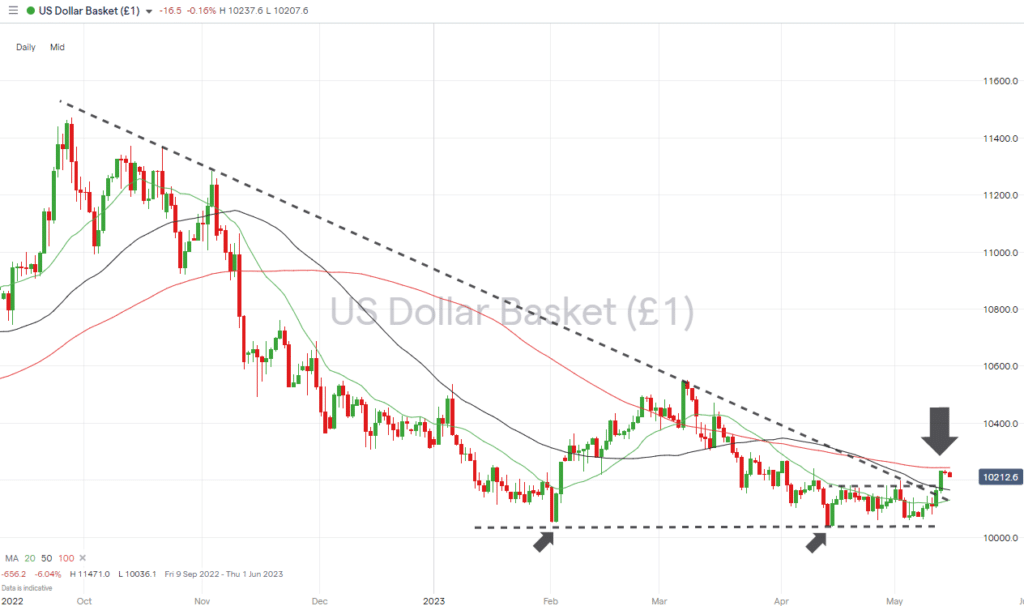
Source: IG
US Dollar Basket Chart – Hourly Price Chart
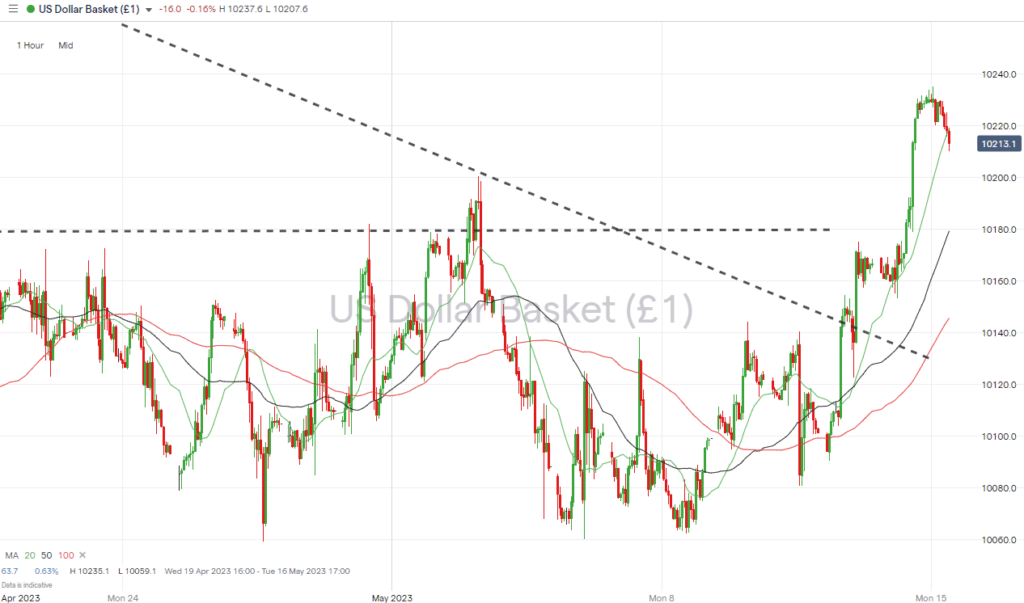
Source: IG
Short positions
- Entry Level 1: 102.44 – Region of the 100 SMA on the Daily Price Chart. Should price reach this key metric it would represent an opportunity to short-sell the dollar.
- Price Target 1: 101.65 – Region of the 50 SMA on the Daily Price Chart. Acted as resistance during the upwards price move of Thursday 11th May.
- Price Target 2: 101.30 – Convergence of the upper trendline of the wedge pattern and 20 SMA on Daily Price Chart.
- Price Target 3: 100.00 – In extension, psychologically important price level.
- Stop Loss: > 102.44 – 100 SMA on the Daily Price Chart.
Long positions
- Entry Level 1: 101.65 – The RSI on the Daily Price Chart sits at 58.9 which means DXY is far from being overbought on that timeframe. But following the dramatic price rise between Thursday and Friday, the chance of a short-term pullback can’t be discounted. The 50 SMA on the Daily Price Chart could provide an entrance point for those looking to go long.
- Price Target 1: 102.35 – Month to date price high and region of 100 SMA on the Daily Price Chart.
- Stop Loss: < 101.30 – Region of the upper trendline of the wedge pattern and the 20 SMA on Daily Price Chart.
GBPUSD
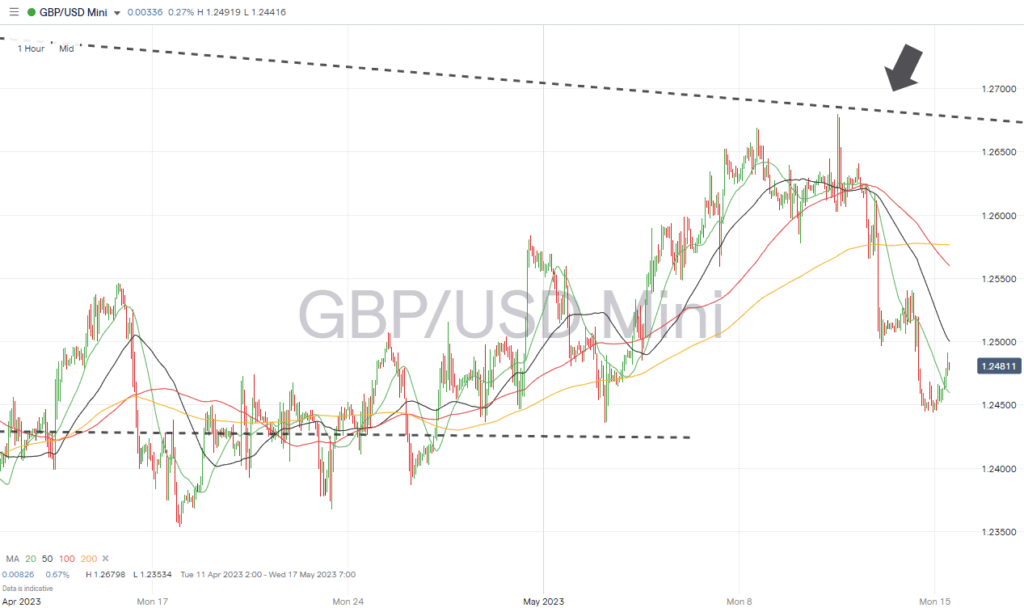
Cable’s failure to break the downwards trendline dating from June 2021 has resulted in the forex pair remaining in a bearish price pattern. All hope is not lost for bulls of GBPUSD who will point to UK inflation being higher than that in the US, and further Bank of England interest rate hikes being likely.
There is also the support/resistance offered in the region of 1.2418 to consider. That marks the level where price formed a ‘double top’ during December 2022 and January 2023.
Daily Price Chart – GBPUSD Chart – Daily Price Chart
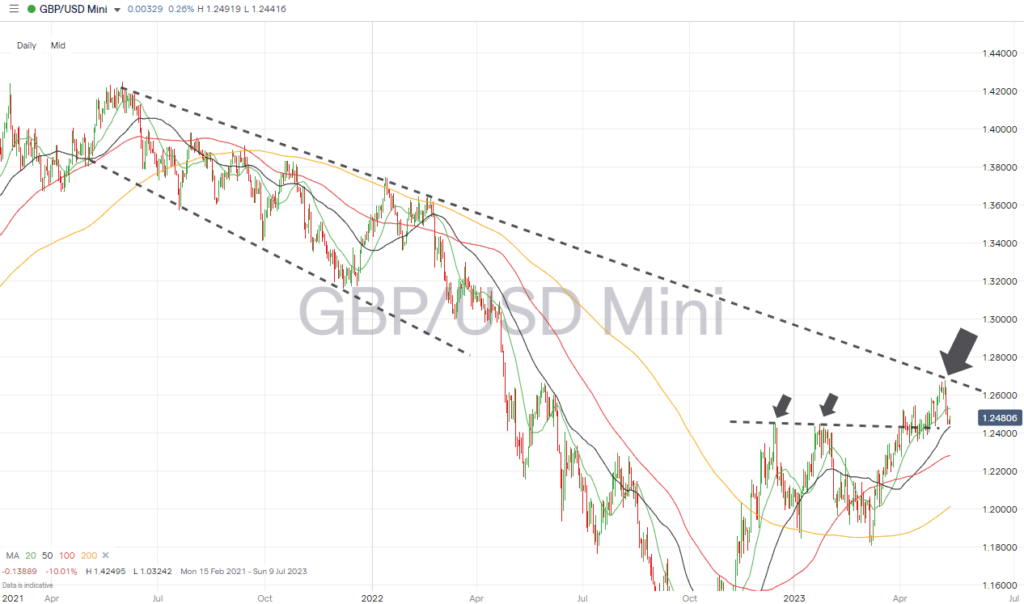
Source: IG
GBPUSD Chart – Hourly Price Chart
Source: IG
Short positions
- Entry Level 1: 1.24339 – A break of the 50 SMA on the Daily Price Chart would tie in with a break of the December-January double top price pattern and open the door to further downwards price movement.
- Price Target 1: 1.22803 – Region of 100 SMA on Daily Price Chart.
- Price Target 2: 1.18030 – In extension, swing-low price recorded on 8th March 2023.
- Stop Loss: > 1.2500 – Psychologically important price level.
Long positions
- Entry Level 1: 1.2418 – GBPUSD has fallen in value by 1.52% since Thursday. A bounce in price can be expected at the point where the 50 SMA and previous support/resistance converge.
- Price Target 1: 1.25287 – Region of 20 SMA on the Daily Price Chart.
- Price Target 2: 1.26798 – in extension, year to date price high of 10th May.
- Stop Loss: < 1.2400 – There are few support levels below the price entry point making a relatively tight stop-loss advisable.
EURUSD
Euro-dollar’s short-term price action can only be described as ‘bearish,’ but the longer-term bull run which started in October 2022 remains intact. That leaves room for the forex pair to move in either direction.
With the RSI on the Daily Price Chart printing at 41.8, that indicator points to the opportunity of there being a short-term bounce in price, a strategy idea backed up by the possibility of the 100 SMA on the Daily Price Chart providing support.
EURUSD Chart – Daily Price Chart
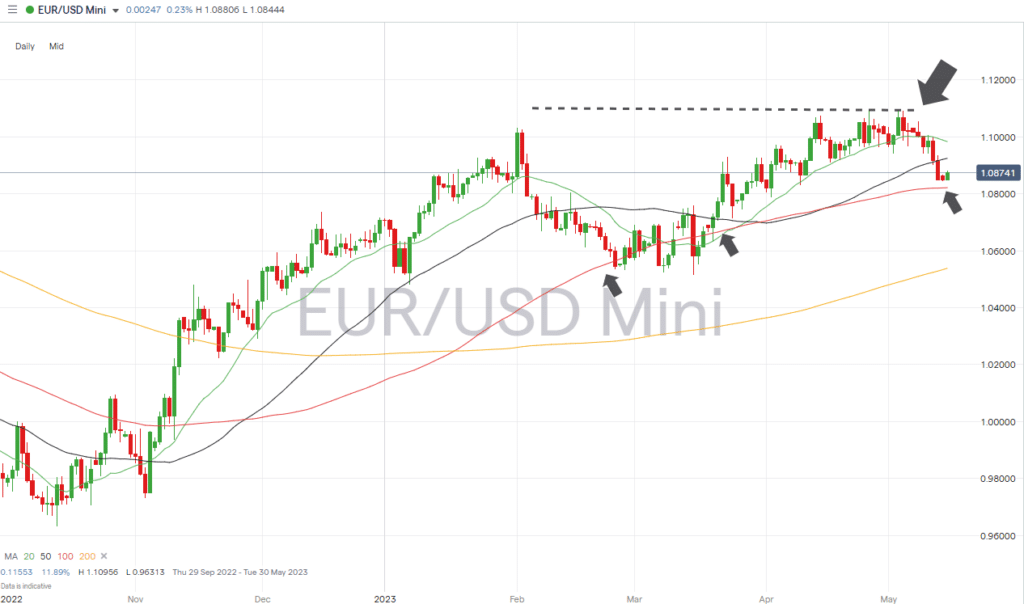
Source: IG
EURUSD Chart – Hourly Price Chart
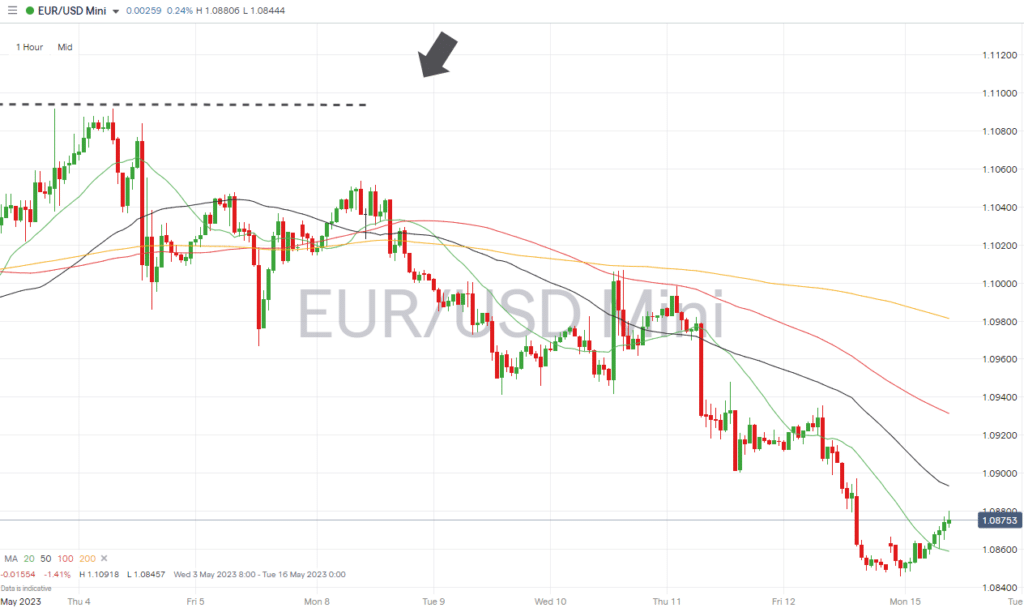
Source: IG
Short positions
- Entry Level 1: 1.08215 – A break through the 100 SMA on the Daily Price Chart could offer the chance to sell-short using a momentum-based strategy.
- Price Target 1: 1.05386 – Region of the price lows of February and March and 200 SMA on the Daily Price Chart.
- Stop Loss: > 1.08495 – Closing price of Friday 12th May.
Long positions
- Entry Level 1: 1.08215 – Region of 100 SMA on the Daily Price Chart.
- Price Target 1: 1.09833 – The 20 SMA on the Daily Price Chart provided significant support during the rally in EURUSD which took place during March and April. That could now act as resistance and is in close proximity to the ‘round number’ resistance offered by the 1.10 price level.
- Price Target 2: 1.10956 – Year-to-date price high printed on 26th April.
- Stop Loss: < 1.07133 – Swing-low price low of 24th March.
Indices
S&P 500
Should the US debt-ceiling debate fail to be resolved, there would be serious ramifications for the value of US stocks. That uncertainty has resulted in stocks pausing the bull run which started in October 2022 and trading sideways, with the S&P 500 index spending last week inside the tight price range of 4,098 – 4,158.
S&P 500 Chart – Daily Price Chart – Ascending Wedge Pattern
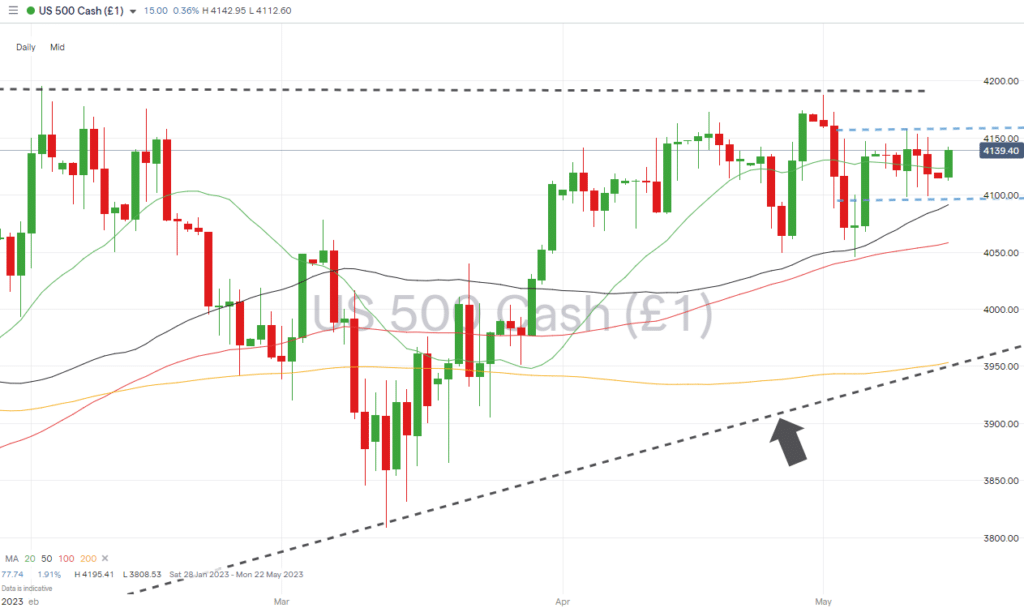
Source: IG
S&P 500 – Hourly Price Chart
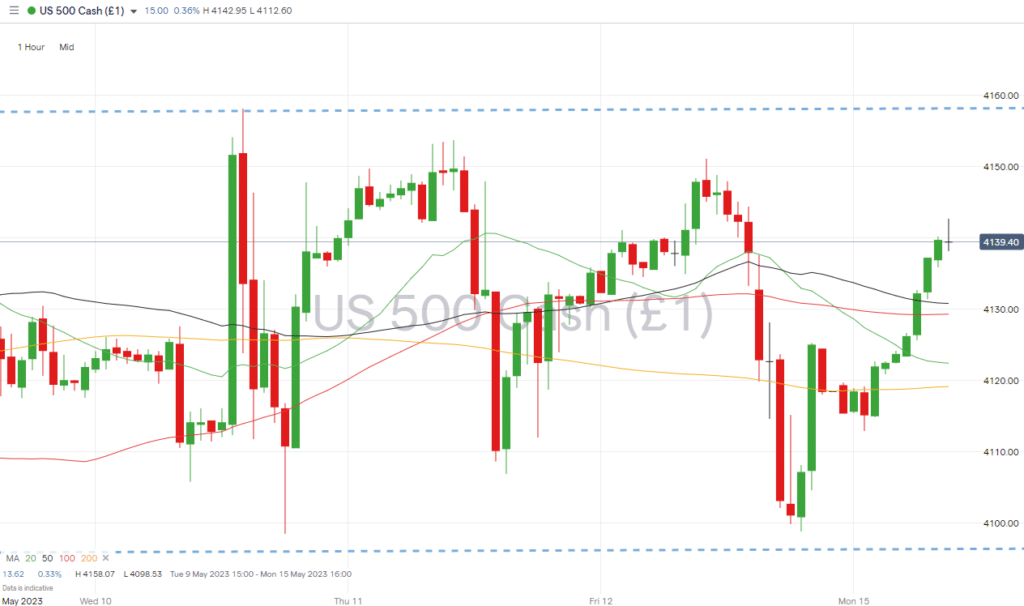
Source: IG
Short positions
- Entry Level 1: 4,158 – Last week’s price high printed on Wednesday 10th May.
- Price Target 1: 4,123 – Region of the 20 SMA on Daily Price Chart.
- Price Target 2: 4,098 – Price low of Friday 12th May.
- Stop Loss: > 4,195 – Year-to-date price high of 2nd February 2023.
Long positions
- Entry Level 1: 4,096 – Bottom of sideways trading channel.
- Price Target 1: 4,123 – Region of the 20 SMA on Daily Price Chart.
- Price Target 2: 4,158 – Price high of Wednesday 10th May.
- Stop Loss: < 4,00 – Psychologically important price level.
Crypto – Bitcoin & Ethereum
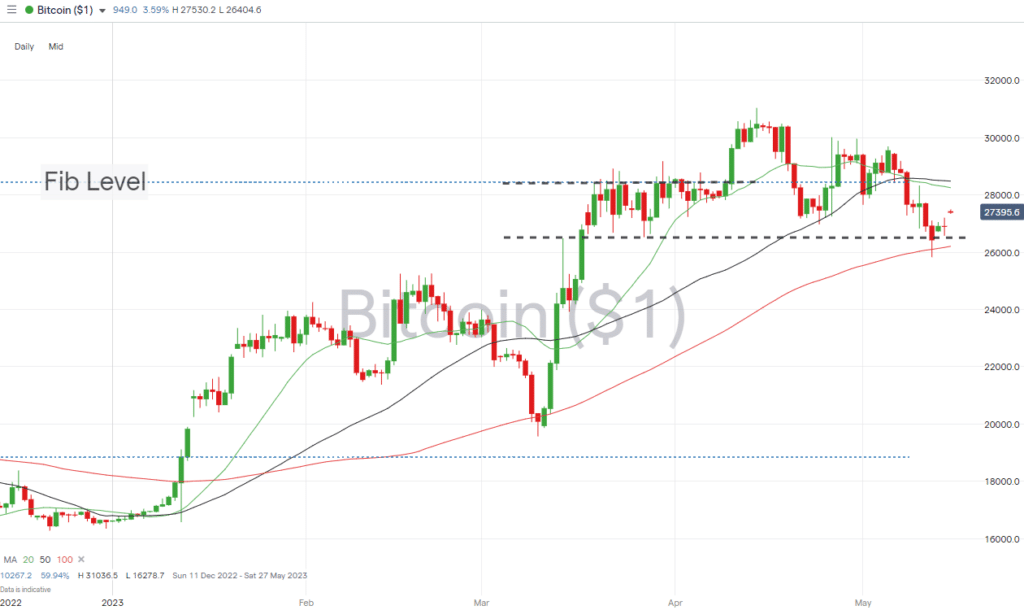
2023’s crypto bull run experienced a short-term pullback last week. Bitcoin lost +4% in value and Ethereum gave up 2.72%.
The key technical indicators to monitor continue to be the Fibonacci retracement levels of the November 2021 – June 2022 sell off which have guided price since mid-March.
Bitcoin Price Chart – Daily Price Chart
Source: IG
Bitcoin Long positions
- Entry Level 1: 26,429 – Closing price of Friday 12th May.
- Price Target 1: 26,981 – Swing-low of 24th April 2023.
- Price Target 2: 28,253 – Area of the 20 and 50 SMA on the Daily Price Chart.
- Price Target 3: 28,952 – Level of 61.8% Fib retracement formed by the upwards price move in Bitcoin recorded between February 2019 and November 2021.
- Stop Losses: < 26,208 – Region of the 100 SMA on the Daily Price Chart.
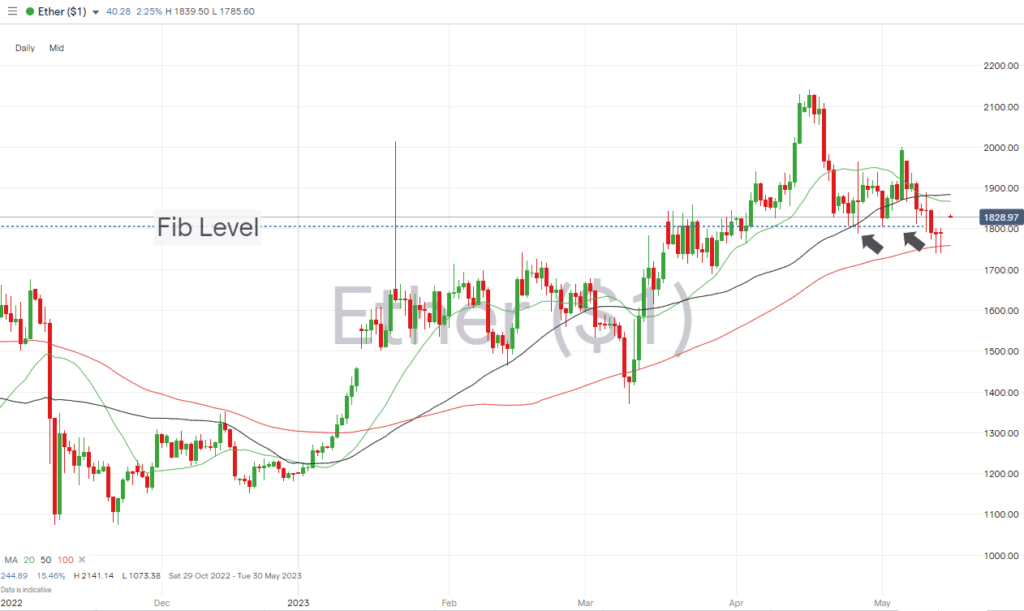
Ethereum
Ethereum Chart – Daily Price Chart
Source: IG
Ethereum Long positions
- Entry Level 1: 1,759 – Region of the 100 SMA on the Daily Price Chart.
- Price Target 1: 1,806 – 23.6% Fibonacci retracement level of the November 2021 to June 2022 price crash.
- Price Target 2: 1,884 – Region of the 50 SMA on the Daily Price Chart.
- Price Target 3: 2,000 – Psychologically important round number support/resistance level.
- Price Target 4: 2,141 – In extension, price high of 16th April 2023.
- Stop Losses: < 1,687 – 27th March 2023 swing-low price level.
Risk Statement: Trading financial products carries a high risk to your capital, especially trading leverage products such as CFDs. They may not be suitable for everyone. Please make sure that you fully understand the risks. You should consider whether you can afford to take the risk of losing your money.

Forextraders' Broker of the Month
BlackBull Markets is a reliable and well-respected trading platform that provides its customers with high-quality access to a wide range of asset groups. The broker is headquartered in New Zealand which explains why it has flown under the radar for a few years but it is a great broker that is now building a global following. The BlackBull Markets site is intuitive and easy to use, making it an ideal choice for beginners.