
FOCUS ON: UK and Eurozone Currency Pairs
- Bank of England sets interest rates on Thursday
- Consumer sentiment and inflation reports in UK and the Eurozone throughout the week
- How will risk appetite be influenced by the next round of data releases?
Trading Ideas
We created this Weekly Tips section to share possible trade entry and exit points based on our technical analysis. We also have other methods to validate our trades which we can’t publicly share that help to increase their success. All our trades include entry and at least one target price. Stop losses are applied at the reader’s discretion. Our strategies typically trade with a wide stop loss, and risk is further mitigated by trading in small sizes.
Instrument | Price | Hourly | Daily |
GBP/USD | 1.2813 | Neutral | Strong Buy |
EUR/USD | 1.0930 | Sell | Strong Buy |
USD/JPY | 141.68 | Neutral | Strong Buy |
S&P 500 | 4,407 | Buy | Strong Buy |
NASDAQ 100 | 15,096 | Neutral | Strong Buy |
FTSE100 | 7,605 | Buy | Strong Buy |
Gold | 1,954 | Strong Sell | Strong Sell |
Crude Oil WTI | 71.24 | Buy | Neutral |
Bitcoin | 26,388 | Buy | Strong Buy |
Ethereum | 1,721 | Neutral | Buy |
UTC: 08:56
US Dollar Basket Index (DXY)
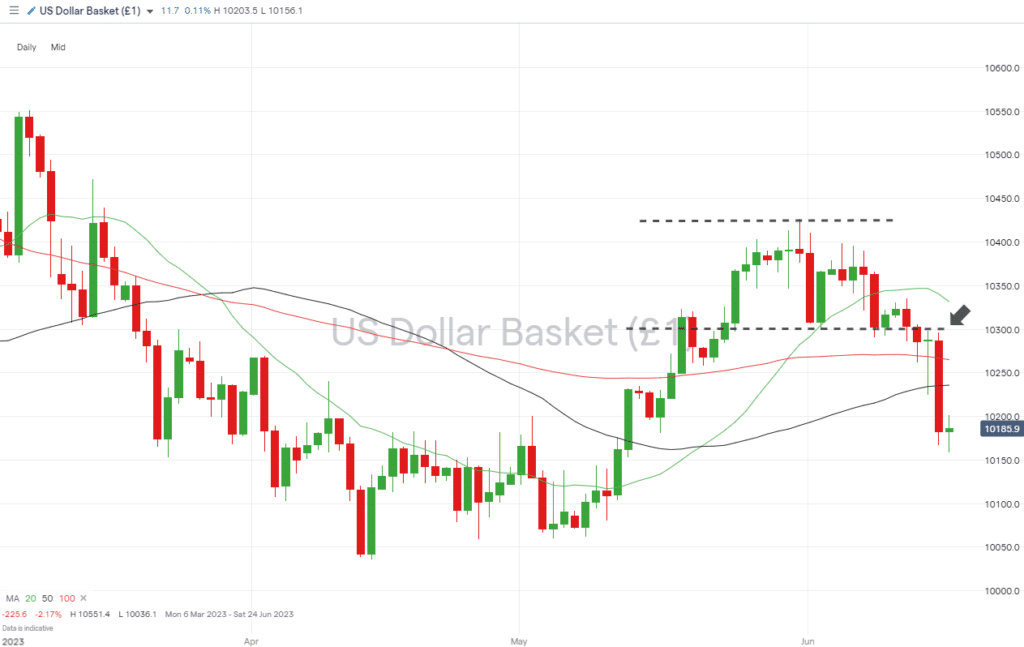
Last week’s break of the 102.98 support level identified in this report represents a significant move by the US Dollar Basket index. Triggered by a benign inflation number of 4% year-on-year price rises in the US CPI report of Tuesday, there was little reason for the Fed to raise the interest rate in June’s meeting.
Guidance from Jerome Powell and the rest of the FOMC took on a hawkish tone but was not enough to stop the DXY from posting a weekly loss of 1.26% as traders focussed on US interest rates remaining unchanged, while Eurozone rates were raised 25 basis points.
US Dollar Basket Chart – Daily Price Chart – Break of Support Level
Source: IG
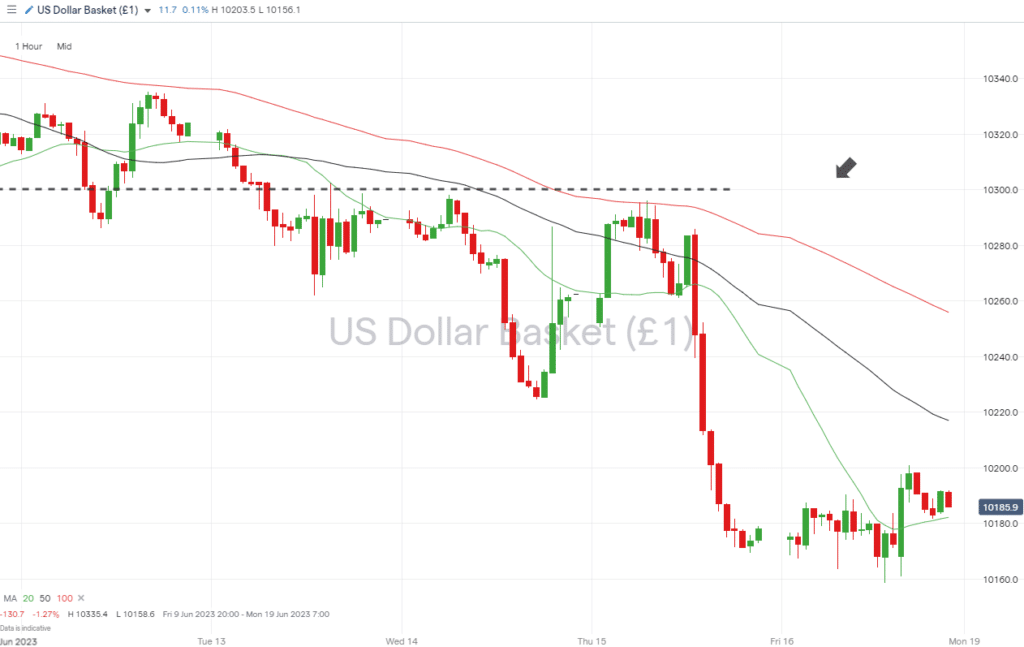
US Dollar Basket Chart – Hourly Price Chart
Source: IG
Short positions
- Entry Level 1: 102.90 – A revisit of the previous month-to-date price low of 102.90 would present a shorting opportunity for those who expect the disconnect between US interest rates and those of other major economies to continue.
- Price Target 1: 102.35 – Region of the 100 SMA on the Daily Price Chart.
- Price Target 2: 101.58 – Intraday price low, new month-to-date low, printed on Friday 16th June.
- Stop Loss: > 103.31 – Region of the 20 SMA on the Daily Price Chart.
Long positions
- Entry Level 1: 101.24 – The 100 SMA on the Weekly Price Chart provided considerable support for the DXY between 10th April and 10th May.
- Price Target 1: 102.90 – Support level which could now act as resistance.
- Price Target 2: 104.26 – Year-to-date price high recorded on 31st May.
- Stop Loss: < 100.00 – Psychologically important parity price level.
GBPUSD
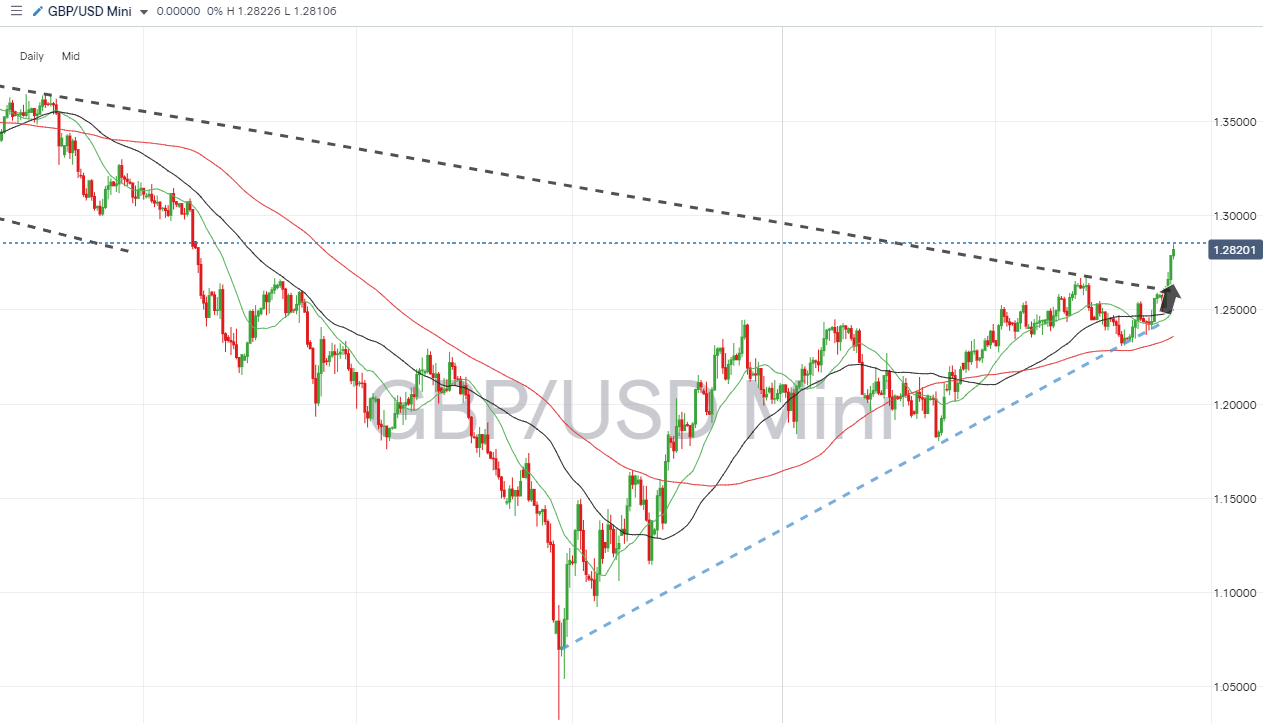
A busy week lies ahead for traders of sterling-based currency pairs. The Bank of England’s announcement last week that inflation and interest rates are expected to remain higher for longer spooked the markets and resulted in GBPUSD posting a +2.00% gain.
Few expect the BoE to deviate from its current path of raising interest rates when it meets on Thursday.
Daily Price Chart – GBPUSD Chart – Daily Price Chart – Trendline Break Confirmed
Source: IG
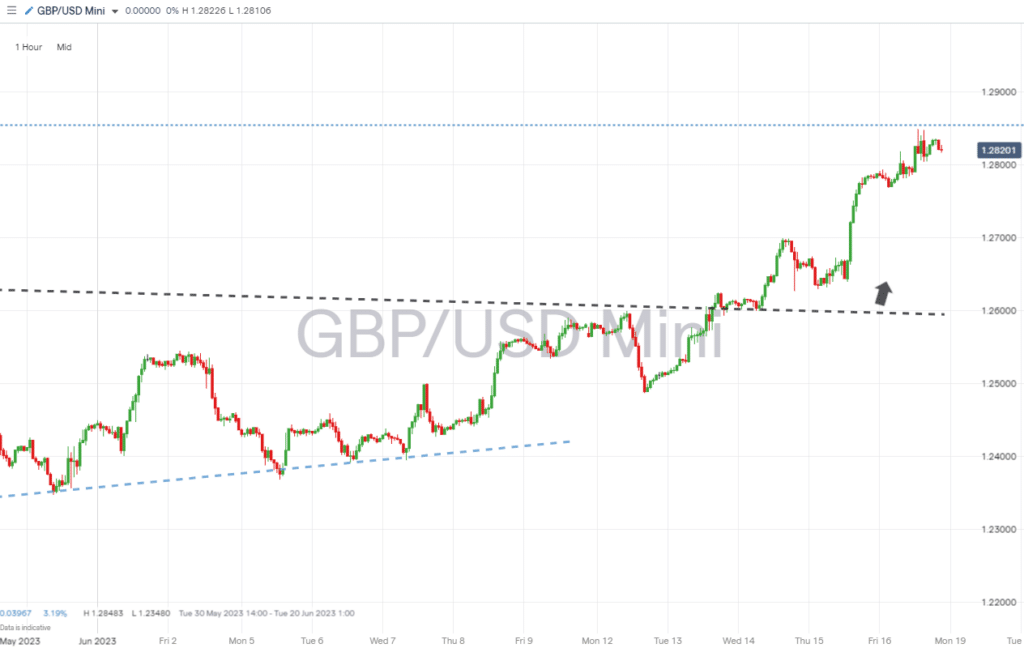
GBPUSD Chart – Hourly Price Chart
Source: IG
Short positions
- Entry Level 1: 1.28709 – Following the break of the multi-month downward trendline, there are few near-term resistance points for GBPUSD. One is the 50 SMA on the Monthly Price Chart, a metric price hasn’t traded above since April 2022.
- Price Target 1: 1.25977 – Region of the downward trendline, which dates back to June 2021.
- Price Target 2: 1.25013 – Point of convergence of both the 20 and 50 SMAs on the Daily Price Chart.
- Stop Loss: > 1.2900 – ‘Round number’, psychologically important price level.
Long positions
- Entry Level 1: 1.27876 – Applying a momentum based strategy and using the opening price of Friday 16th June as an entry point for long positions.
- Price Target 1: 1.28483 – New year-to-date price high recorded on 16th June.
- Price Target 2: 1.28539 – The 23.6% Fibonacci retracement level of the multi-year downward price move from November 2007 to September 2022.
- Price Target 3: 1.300 – In extension, psychologically important price level.
- Stop Loss: < 1.25013 – Convergence of the 20 and 50 SMAs on the Daily Price Chart.
EURUSD
The markets had already priced in the 25-basis point interest rate hike announced by the ECB last week, but the simultaneous pause by the Fed triggered a week-on-week gain of 1.75% in EURUSD.
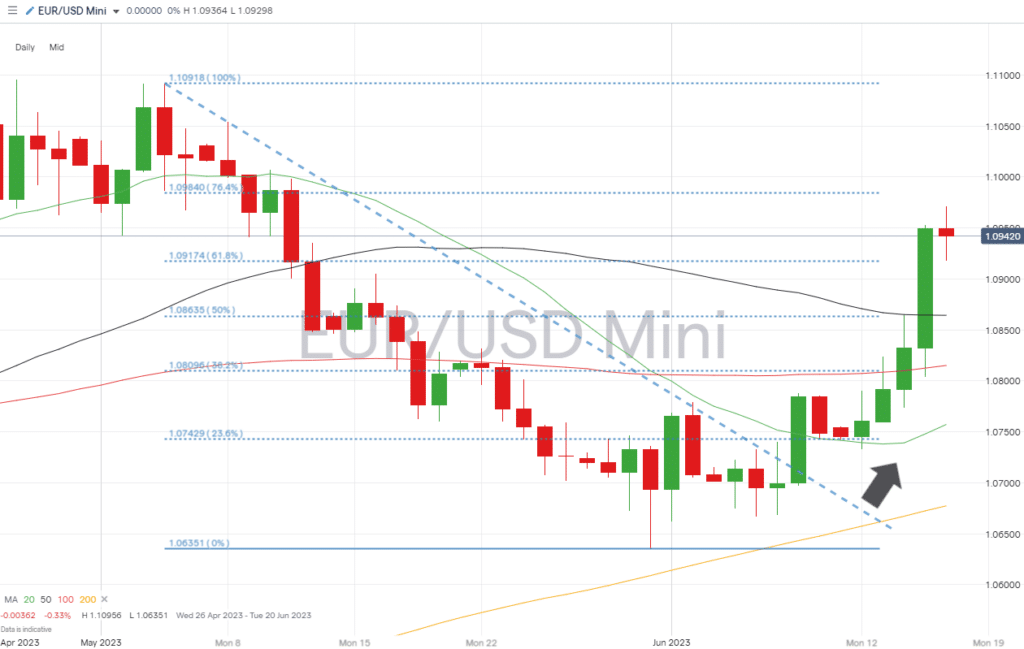
The Eurozone consumer sentiment reports are due this week but might do little to dent the upward momentum seen in Eurodollar. However, those with long positions will note the resistance indicators, which sit just above 1.10900.
EURUSD Chart – Daily Price Chart – Upward momentum after trendline break
Source: IG
EURUSD Chart – Hourly Price Chart

Source: IG
Short positions
- Entry Level 1: 1.09708 – EURUSD spent Friday trading within a price channel of 1.09180 and 1.09708. Shorting opportunities lie near the top end of that channel which could represent the forming of a short-term price consolidation pattern.
- Price Target 1: 1.09180 – Lower level of sideways trading pattern on the Hourly Price Chart.
- Price Target 2: 1.08635 – Intraday price high of 14th June and region of the 50% Fibonacci retracement support level.
- Stop Loss: > 1.09840 – 76.4% Fibonacci retracement price level, which sits just above the month-to-date high.
Long positions
- Entry Level 1: 1.09180 – Support level of the sideways trading channel, which formed on Thursday 15th June.
- Price Target 1: 1.09708 – Upper trendline of the short-term price consolidation pattern.
- Price Target 2: 1.1000 – In extension, ‘round number’ resistance level.
- Stop Loss: < 1.08642 – Region of the 50 SMA on the Daily Price Chart.
Indices
S&P 500
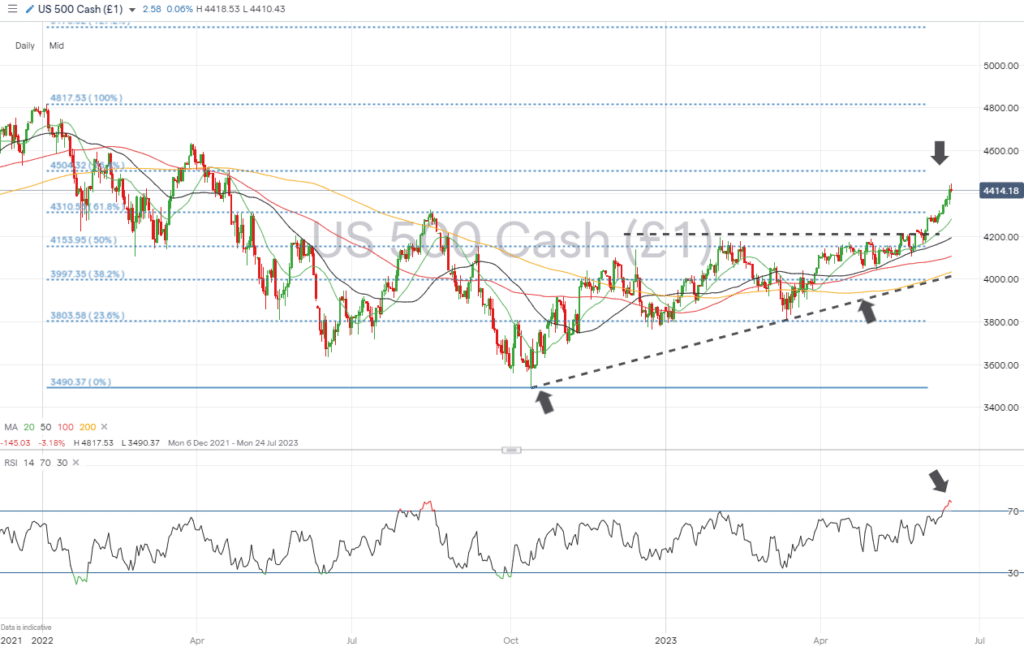
On Friday, the S&P 500 index printed an intraday price high of 4447.33. That was a 12-month high representing a 27.43% increase in value from the 2022 low price of 3490.37 recorded on 13th October.
The +20% gain in value, which confirms a bull market is in place, has been associated with aggressive buying, which has taken the RSI on the Daily Price Chart to +75. That leaves the S&P 500 overbought on a daily timeframe, and traders are left pondering if it is too late to buy and too early to sell.
S&P 500 Chart – Daily Price Chart – RSI +70 and Overbought
Source: IG
S&P 500 – Hourly Price Chart
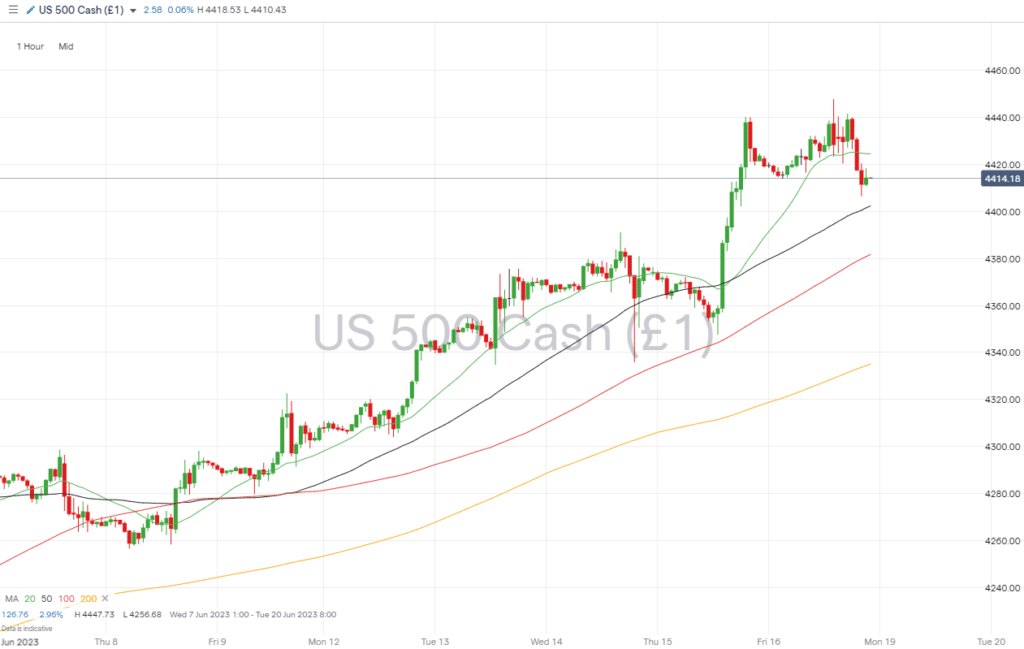
Source: IG
Short positions
- Entry Level 1: 4,504.32 – Near to the psychologically important 4,500 price level and 61.8% Fibonacci retracement level of the price fall from 4th January to 13th October 2022. The last time the RSI was more than 70 on the Daily Price Chart was in August 2022, and over the following 48 trading sessions, the index recorded an 18.50% fall in value.
- Price Target 1: 4,310 – 61.8% Fibonacci retracement level of the price fall from 4th January to 13th October 2022. Also, in the region of the 20 SMA on the Daily Price Chart (4,281).
- Price Target 2: 4,193 – Region of the 50 SMA on the Daily Price Chart and 50% retracement level of the Jan-Oct 2022 Fib price pattern (4153).
- Price Target 3: 4,029 – In extension, region of the 200 SMA on the Daily Price Chart and supporting trendline of the upward trend started on 13th October 2022.
- Stop Loss: > 4,637 – Price high of 26th March 2022.
Long positions
- Entry Level 1: 4,382 – Buying into short-term weakness, which takes price back to the 100 SMA on the Hourly Price Chart.
- Price Target 1: 4,447.73 – June month-to-date price high printed on Friday 16th June.
- Stop Loss: < 4,281 – Region of the 20 SMA on Daily Price Chart and 61.8% Fib retracement support/resistance price level of 4,310.55.
Crypto – Bitcoin & Ethereum
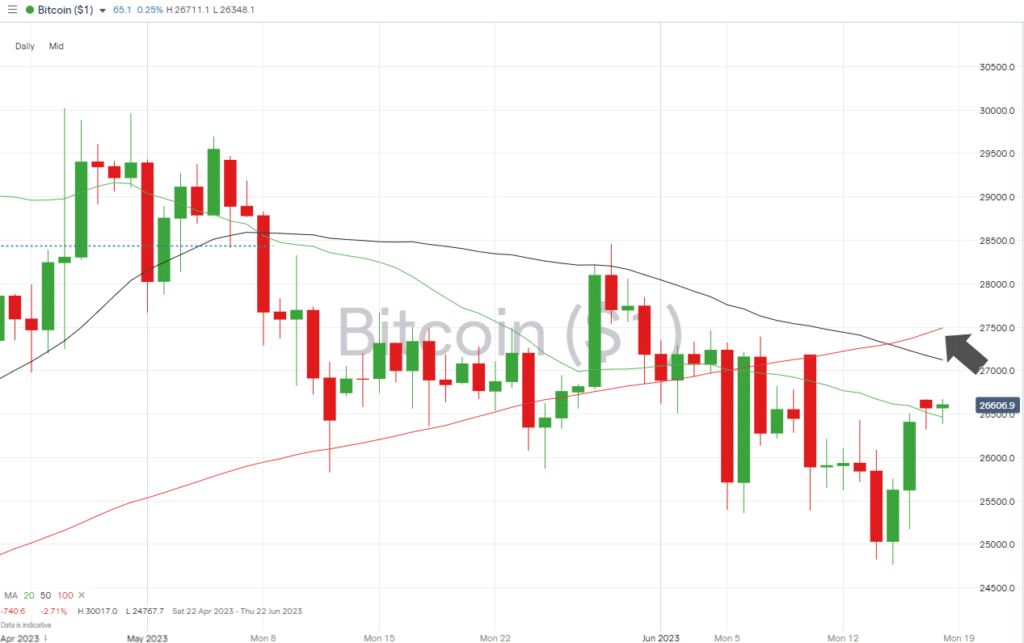
Mid-week price weakness in the major cryptos resulted in Ethereum and Bitcoin testing key support levels, but the subsequent bounce can be interpreted as a positive sign. Both BTC and ETH are currently trading below the 100 SMA on the Daily Price Chart, and that resistance level needs to be tested or broken if upward momentum is to be maintained.
Bitcoin Price Chart – Daily Price Chart
Source: IG
Bitcoin Long positions
- Entry Level 1: 27,491 – A test of the key 100 SMA on the Daily Price Chart appears possible, and some will be waiting for a confirmed break of that metric before going long Bitcoin.
- Price Target 1: 28,455 – Price high of 29th May.
- Price Target 2: 31,036 – In extension, year-to-date price high of 14th April.
- Stop Losses: < 27,123 – Region of the 50 SMA on the Daily Price Chart.
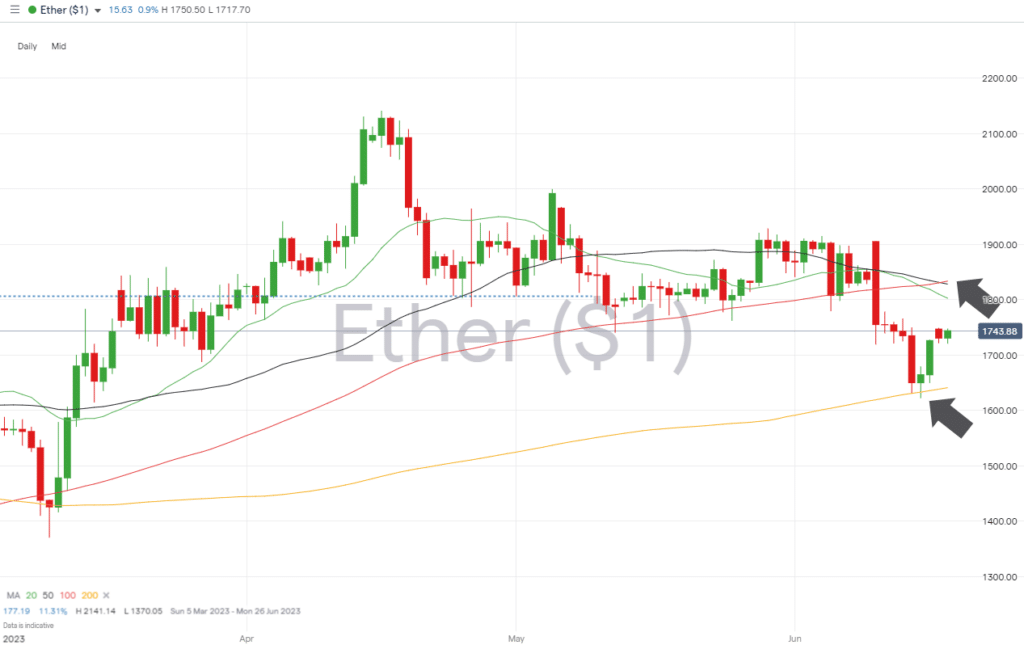
Ethereum
Ethereum Chart – Daily Price Chart
Source: IG
Ethereum Long positions
- Entry Level 1: 1,802 – The convergence of the 50 and 100 SMAs in the region of 1828 on the Daily Price Chart makes those price levels a likely target for price action. The 20 SMA, which sits just below the other two SMAs, could be an entry point for those looking to go long. And 1806 marks the 23.6% Fib retracement price level of the 2022 price crash.
- Price Target 1: 1,917 – June, month-to-date price high.
- Price Target 2: 2,000 – Psychologically important support/resistance price level last tested on 5th May.
- Price Target 3: 2,141 – In extension, year-to-date price high printed on 16th April.
- Stop Losses: < 1,640 – Region of the 200 SMA on the Daily Price Chart.
Risk Statement: Trading financial products carries a high risk to your capital, especially trading leverage products such as CFDs. They may not be suitable for everyone. Please make sure that you fully understand the risks. You should consider whether you can afford to risk losing your money.

Forextraders' Broker of the Month
BlackBull Markets is a reliable and well-respected trading platform that provides its customers with high-quality access to a wide range of asset groups. The broker is headquartered in New Zealand which explains why it has flown under the radar for a few years but it is a great broker that is now building a global following. The BlackBull Markets site is intuitive and easy to use, making it an ideal choice for beginners.