
FOCUS ON: Risk Appetite Returns and Takes Prices to Key Support/Resistance Levels
- US holiday sets tone for a quieter week in terms of news announcements
- An absence of news leaves room for technical indicators to guide price
- Increased risk appetite seen at the end of last week takes markets to key price support/resistance levels
Trading Ideas
We created this Weekly Tips section to share possible trade entry and exit points based on our technical analysis. We also have other methods to validate our trades which we can’t publicly share that help to increase their success. All our trades include entry and at least one target price. Stop losses are applied at the reader’s discretion. Our strategies typically trade with a wide stop loss, and risk is further mitigated by trading in small sizes.
Instrument | Price | Hourly | Daily |
GBP/USD | 1.2625 | Strong Buy | Buy |
EUR/USD | 1.0801 | Neutral | Strong Sell |
USD/JPY | 146.42 | Strong Buy | Strong Buy |
S&P 500 | 4,552 | Strong Buy | Strong Buy |
NASDAQ 100 | 15,528 | Strong Buy | Strong Buy |
FTSE100 | 7,507 | Strong Buy | Neutral |
Gold | 1,943 | Strong Buy | Strong Buy |
Crude Oil WTI | 85.21 | Neutral | Strong Buy |
Bitcoin | 25,910 | Neutral | Sell |
Ethereum | 1,635 | Strong Buy | Strong Sell |
UTC: 09:54
US Dollar Basket Index (DXY)
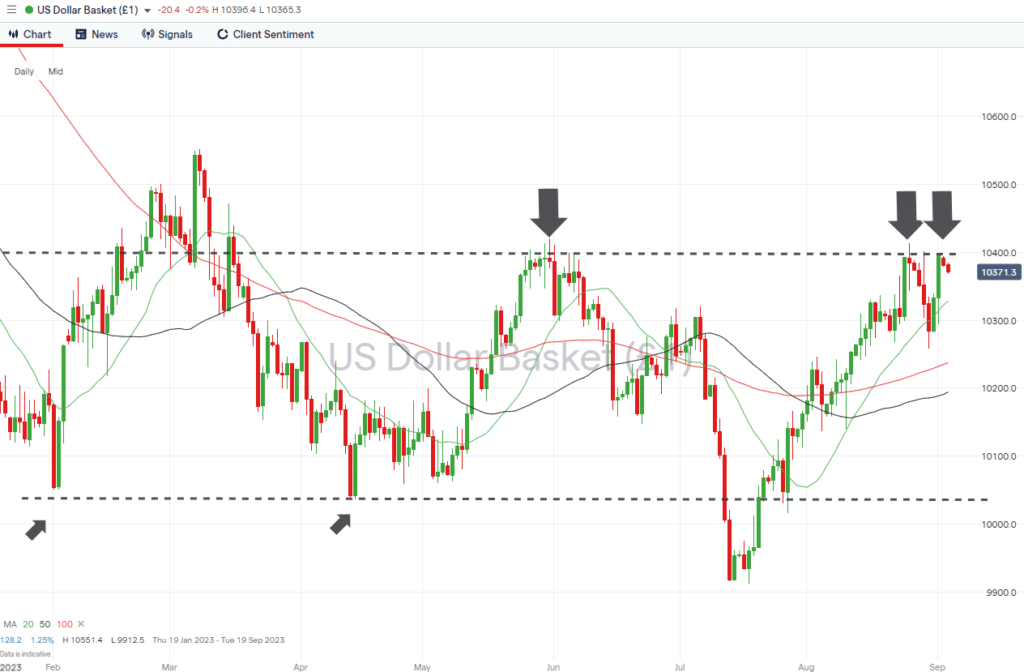
A heavy week in terms of news announcements was capped off on Friday by the US Non-Farm Payroll jobs numbers. A paradoxical rise in employment and unemployment levels was taken as a positive by investors, with risk-on assets finishing strongly into the close. From a technical perspective, the US Dollar Basket Index could be forming a double, or triple-top price pattern.
US Dollar Basket Chart – Daily Price Chart
Source: IG
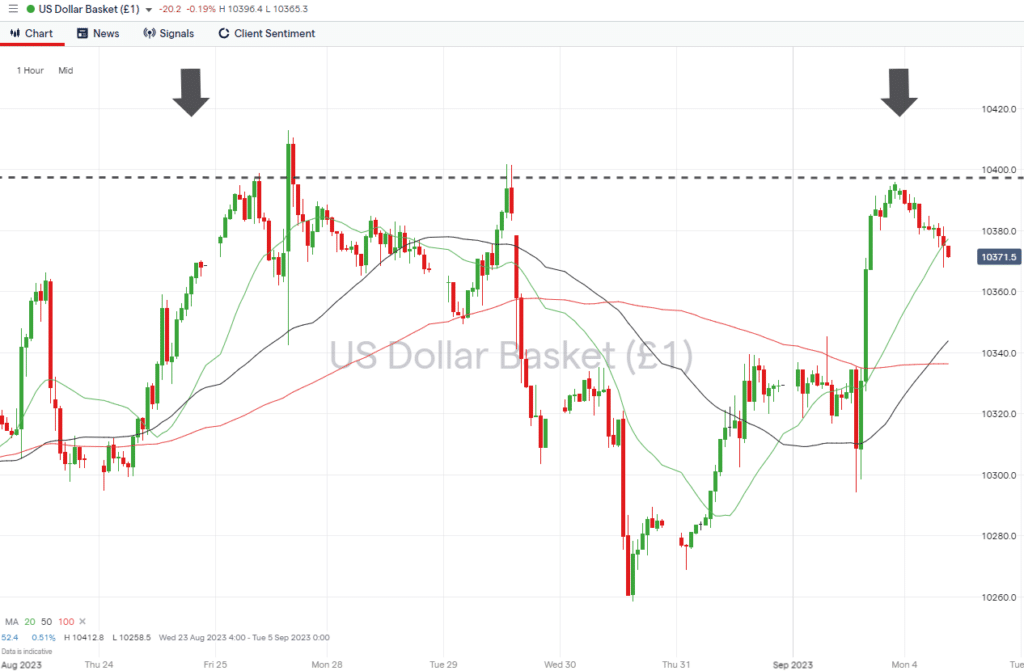
US Dollar Basket Chart – Hourly Price Chart
Source: IG
Short positions
- Entry Level 1: 103.94 – Closing price of Friday 1st September. Part of a potential triple top pattern formed along with 30th May and 24th August closing prices.
- Price Target 1: 103.28 – The price level which previously acted as resistance in June, July, and the week starting 16th August can now be expected to act as support. Also, the region of the 20 SMA (Simple Moving Average) on the Daily Price Chart.
- Price Target 2: 102.58 – Intraday low of 30th August, which now forms an important swing-low based price support level.
- Stop Loss: > 104.12 – Intraday price high printed on Wednesday 25th August.
Long positions
- Entry Level 1: 103.94 – A break of the closing price of Friday 1st September would represent a significant shift in market sentiment and offer a chance for those applying momentum-based strategies.
- Price Target 1: 105.43 – Multi-month high closing price recorded on 7th March.
- Stop Loss: < 103.28 – Region of the 20 SMA on the Daily Price Chart.
GBPUSD
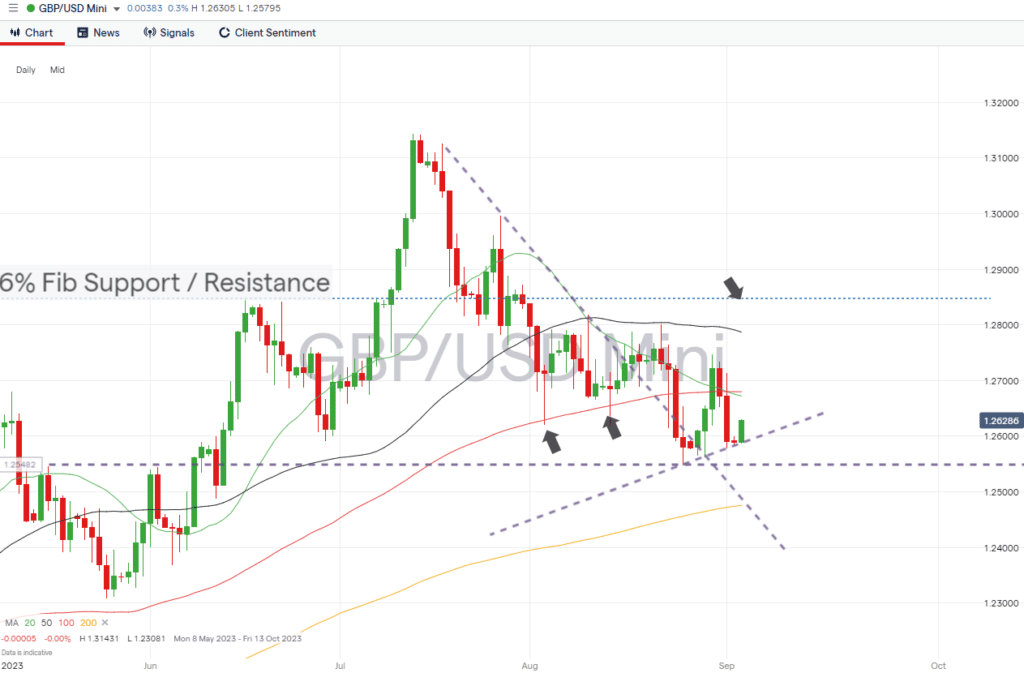
Last week’s revision of UK GDP statistics revealed that the British economy performed better than previously stated. That additional growth leaves room for the Bank of England to stick with its hawkish policy regarding interest rates and could see the recent slide in the price of cable bottom out in the 1.26 region.
Daily Price Chart – GBPUSD Chart – Daily Price Chart
Source: IG
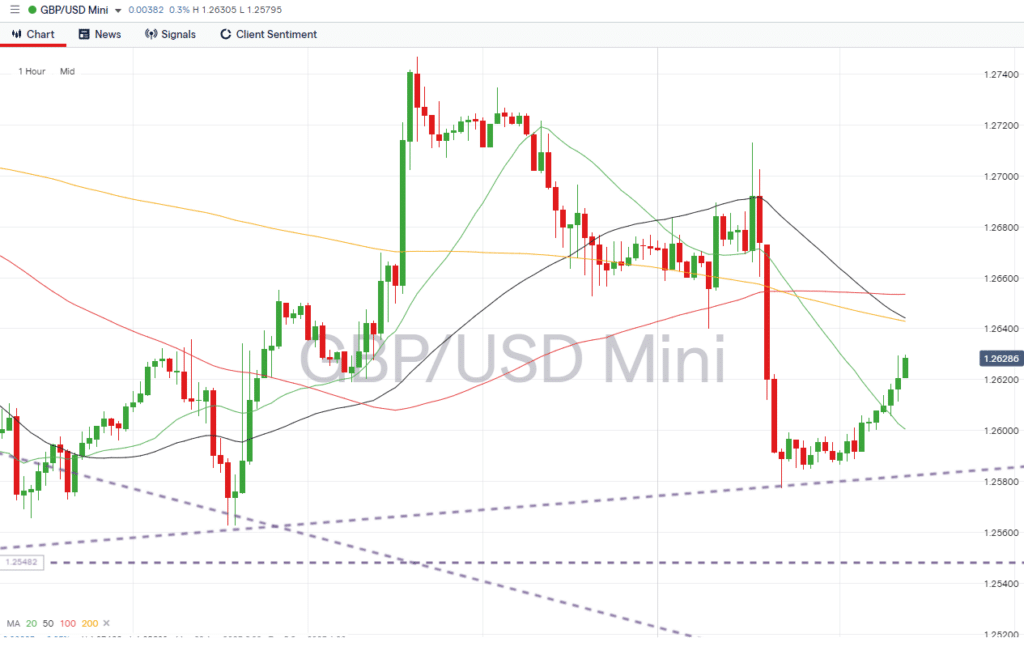
GBPUSD Chart – Hourly Price Chart
Source: IG
Short positions
- Entry Level 1: 1.25480 – Key support level formed by the price low recorded on Friday 25th August.
- Price Target 1: 1.24759 – Region of the 200 SMA on the Daily Price Chart.
- Stop Loss: > 1.2600 – Region of supporting trendline.
Long positions
- Entry Level 1: 1.2600 – Round number support level and region of upward trendline dating back to Friday 25th August.
- Price Target 1: 1.2642 – Region of convergence of the 50, 100, and 200 SMAs on the Hourly Price Chart.
- Price Target 2: 1.2672 – Region of 20 and 100 SMAs on the Daily Price Chart.
- Price Target 3: 1.2840 – In extension, resistance level formed by 23.6% Fibonacci retracement of long-term price move.
- Stop Loss: > 1.25774 – Intraday price low of Friday 1st September.
EURUSD
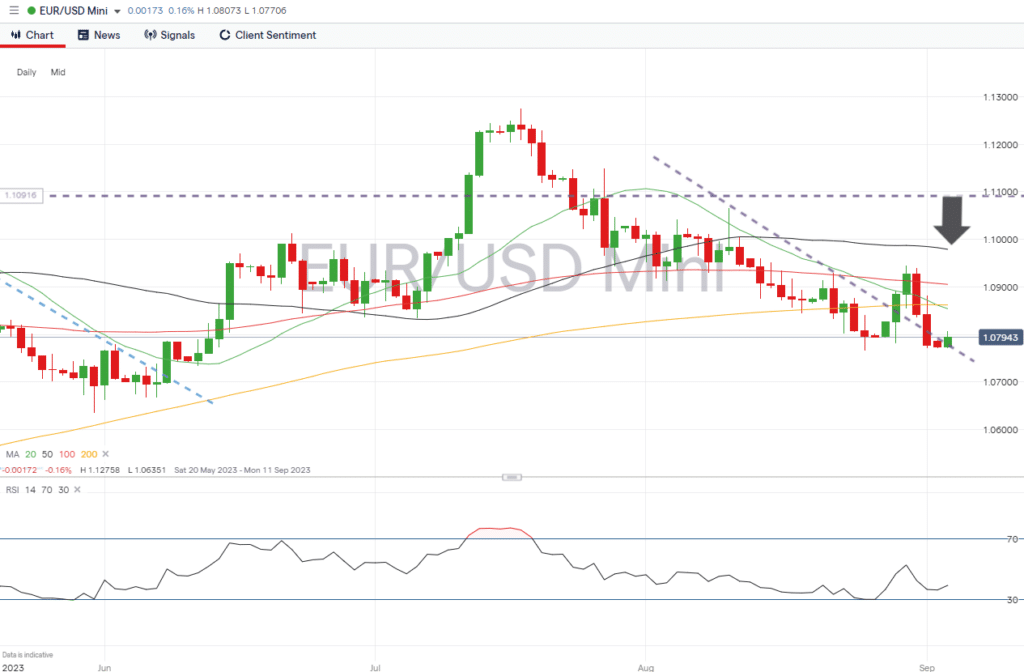
Eurodollar is trading below the 20, 50, and 100 SMAs on the Daily Price Chart, which can only be seen as a bearish indicator. The RSI on the daily time frame is currently 39.3, leaving room for further downward price moves before the market is considered oversold.
EURUSD Chart – Daily Price Chart
Source: IG
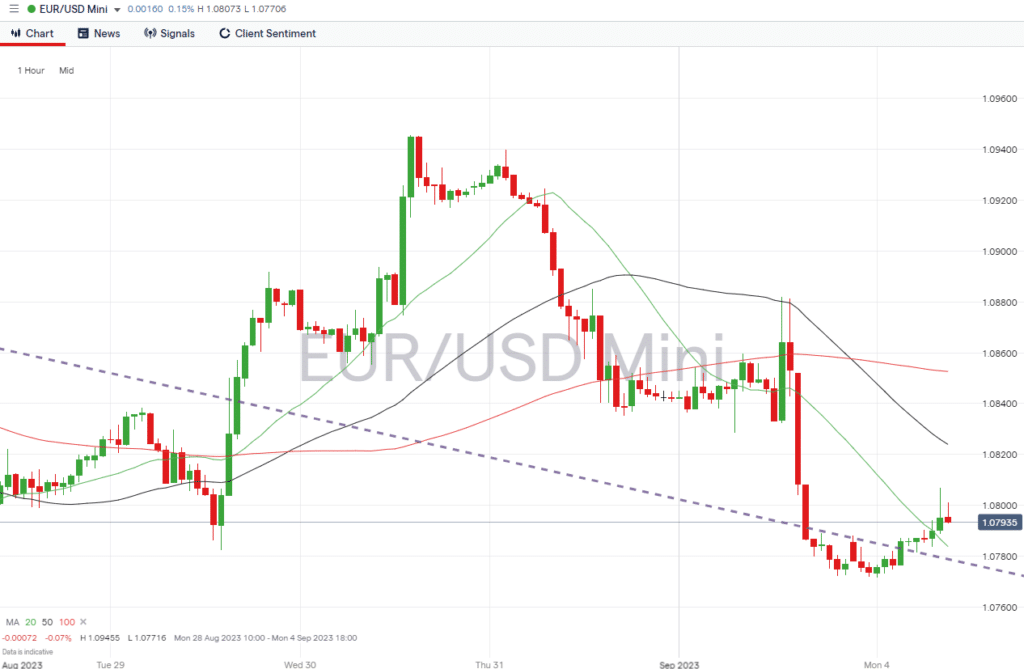
EURUSD Chart – Hourly Price Chart
Source: IG
Short positions
- Entry Level 1: 1.08540 – Region of the 20 SMA on the Daily Price Chart. Last week’s break above this key metric was short-lived, confirming its resistance to any further upward price moves.
- Price Target 1: 1.07720 – Intraday low of 1st September.
- Price Target 2: 1.06351 – Swing low price pattern formed on 31st May.
- Stop Loss: > 1.109053 – Region of the 100 SMA on the Daily Price Chart and round number resistance offered by the 1.0900 price bar.
Long positions
- Entry Level 1: 1.07658 – Multi-month price low printed on 25th August.
- Price Target 1: 1.08539 – Region of the 200 SMA on the Daily Price Chart.
- Price Target 2: 1.10918 – In extension, price high of 3rd May, along with the other price highs recorded in the first half of the year, forms a potential double-top price pattern.
- Stop Loss: < 1.06351 – Swing low price point recorded on 31st May.
Indices
S&P 500
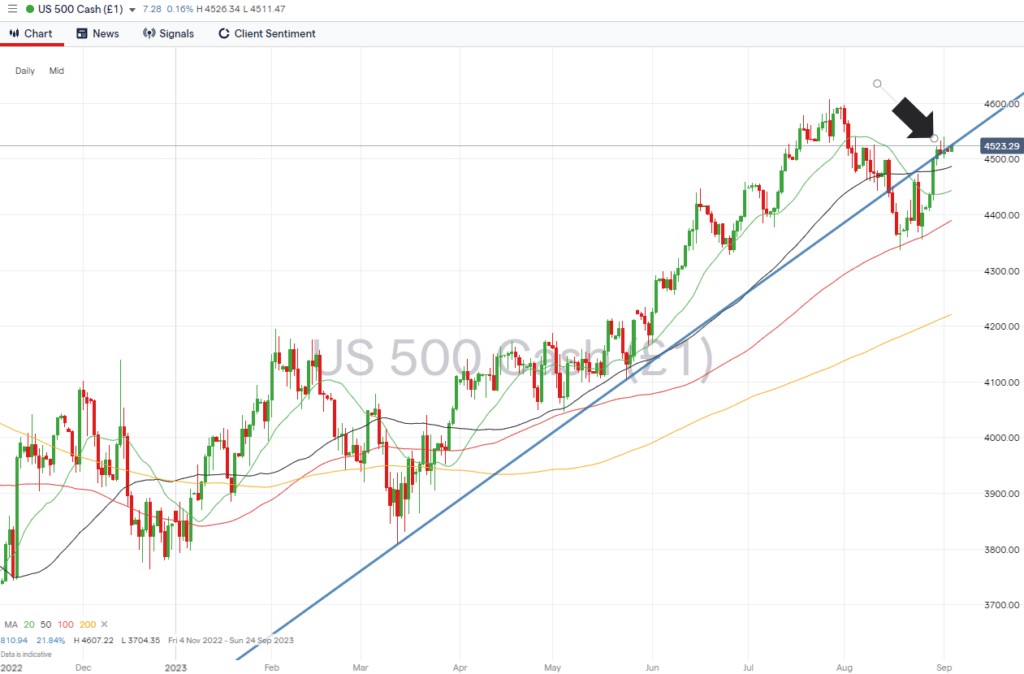
August was a bad month for stock investors, but the bounce into the close of the month saw significant US stock indices post weekly gains of +2% and return to trade above the 20, 50, and 100 SMAs on the Daily Price Chart. The S&P 500 index now sits close to the key trendline that marks the rally in stocks that started in March. That resistance/support level could play an important role in determining if the recent rally will continue to gain momentum.
S&P 500 Chart – Daily Price Chart
Source: IG
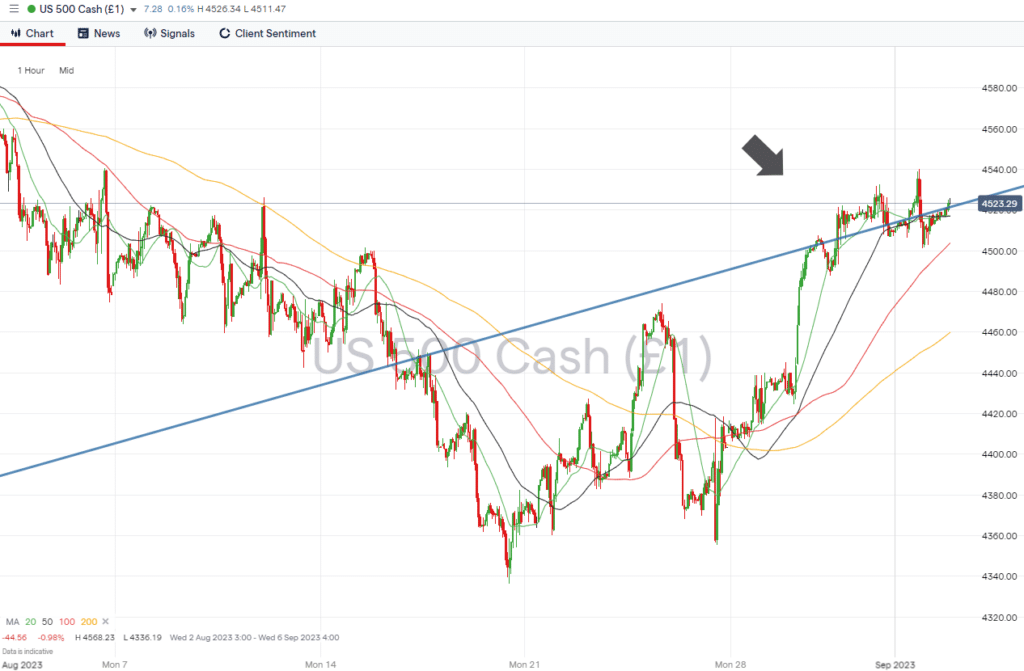
S&P 500 – Hourly Price Chart
Source: IG
Short positions
- Entry Level 1: 4,530 – Using the upward trendline as a guide to enter into short positions.
- Price Target 1: 4,486 – Region of the 50 SMA on the Daily Price Chart.
- Price Target 2: 4,389 – In extension, region of the 100 SMA on the Daily Price Chart. Price has failed to close below this metric since 23rd March.
- Stop Loss: > 4,607 – Year-to-date price high recorded on 27th July.
Long positions
- Entry Level 1: 4,486 – Applying a pull-back strategy to capture buying opportunities in the region of the 50 SMA on the Daily Price Chart should the upward trendline provide short-term resistance.
- Price Target 1: 4,530 – Region of the upward trendline.
- Price Target 2: 4,607 – Year-to-date price high recorded on 27th July.
- Stop Loss: > 4,443 – Region of the 20 SMA on the Daily Price Chart.
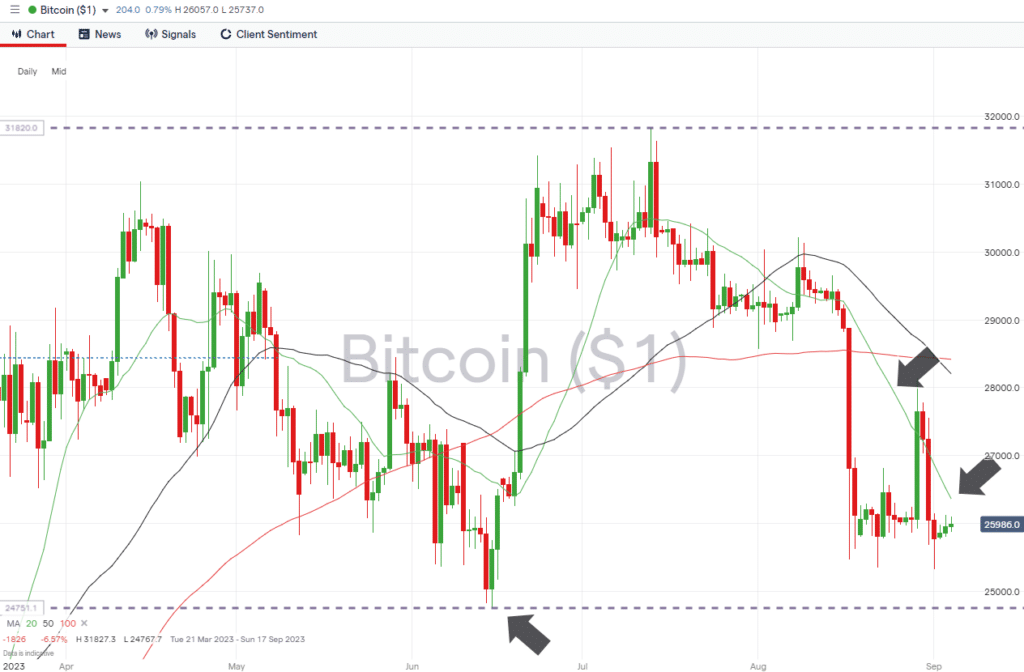
Crypto – Bitcoin & Ethereum
Both the major cryptos ended the week unchanged but recorded extreme midweek spikes in price. The 20 SMA on the Daily Price Chart looks like the key metric for traders of Bitcoin and Ethereum to look out for.
Bitcoin Price Chart – Daily Price Chart
Source: IG
Bitcoin Long positions
- Entry Level 1: 26,367 – Region of the 20 SMA on the Daily Price Chart. A confirmed break of this metric would signal renewed bullish sentiment.
- Price Target 1: 28,207 – Convergence of the 50 and 100 SMAs on the Daily Price Chart.
- Price Target 2: 31,827 – In extension, current year-to-date price high printed on 13th July.
- Stop Losses: < 25,334 – Support level provided by the price low printed on 1st September.
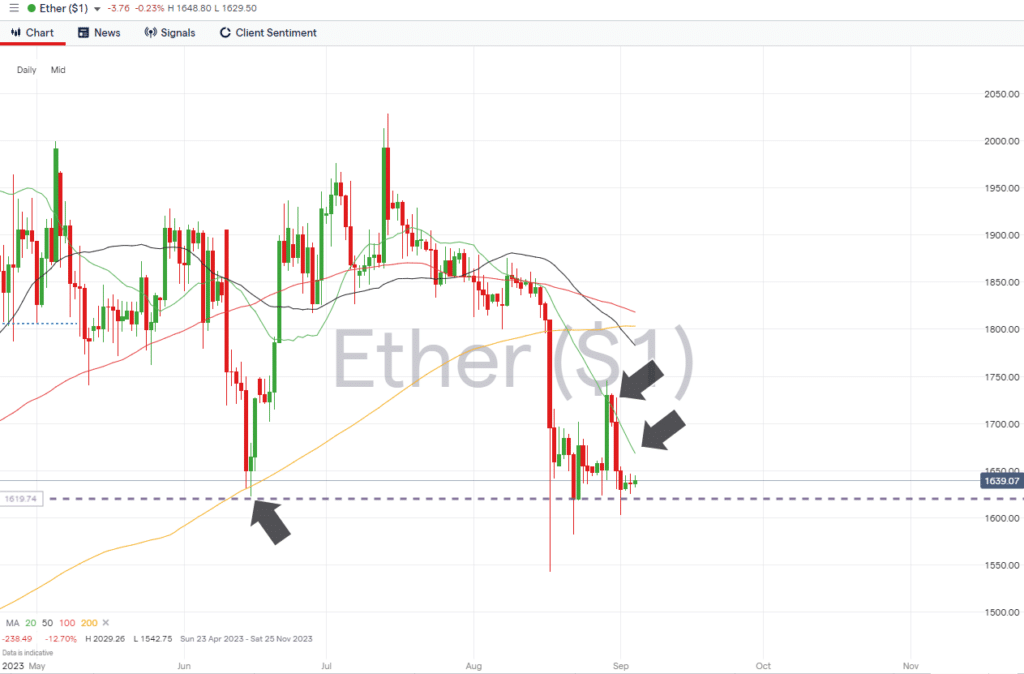
Ethereum
Ethereum Chart – Daily Price Chart
Source: IG
Ethereum Long positions
- Entry Level 1: 1,622 – Intraday price low recorded on 15th June continues to act as price support.
- Price Target 1: 1,782 – Region of the 100 SMA on the Daily Price Chart.
- Price Target 2: 2,000 – Round number price level which previously acted as resistance on 13th and 14th July.
- Price Target 3: 2,141 – In extension, year-to-date price high printed on 16th April.
- Stop Losses: < 1,542 – Multi-month price low recorded on 17th August.
Risk Statement: Trading financial products carries a high risk to your capital, especially trading leverage products such as CFDs. They may not be suitable for everyone. Please make sure that you fully understand the risks. You should consider whether you can afford to take the risk of losing your money.

Forextraders' Broker of the Month
BlackBull Markets is a reliable and well-respected trading platform that provides its customers with high-quality access to a wide range of asset groups. The broker is headquartered in New Zealand which explains why it has flown under the radar for a few years but it is a great broker that is now building a global following. The BlackBull Markets site is intuitive and easy to use, making it an ideal choice for beginners.