
FOCUS ON: Key News Announcements Could Trigger Formation of New Price Trends
- Markets continue to have the potential to move in either direction.
- Inflation news out of the US on Wednesday could act as a catalyst for new trends to form.
- The ECB interest rate decision due on Thursday will also impact investor sentiment.
Trading Ideas
We created this Weekly Tips section to share possible trade entry and exit points based on our technical analysis. We also have other methods to validate our trades which we can’t publicly share that help to increase their success. All our trades include entry and at least one target price. Stop losses are applied at the reader’s discretion. Our strategies typically trade with a wide stop loss, and risk is further mitigated by trading in small size.
Instrument | Price | Hourly | Daily |
GBP/USD | 1.2520 | Strong Buy | Strong Buy |
EUR/USD | 1.0729 | Strong Buy | Strong Sell |
USD/JPY | 146.06 | Strong Sell | Buy |
S&P 500 | 4,478 | Strong Sell | Neutral |
NASDAQ 100 | 15,385 | Strong Buy | Strong Buy |
FTSE100 | 7,542 | Strong Buy | Strong Buy |
Gold | 1,927 | Strong Buy | Neutral |
Crude Oil WTI | 86.83 | Strong Buy | Strong Buy |
Bitcoin | 25,753 | Neutral | Strong Sell |
Ethereum | 1,608 | Strong Sell | Strong Sell |
UTC: 09:42
US Dollar Basket Index (DXY)
After a week in which risk-on assets lost ground, technical indicators are now pointing towards some kind of a bounce. This could be a short-term event with the US CPI inflation report due out on Wednesday. This update on the state of the US economy will give an indication as to whether the US Federal Reserve is likely to adopt a hawkish or dovish approach to interest rate policy.
US Dollar Basket Chart – Daily Price Chart
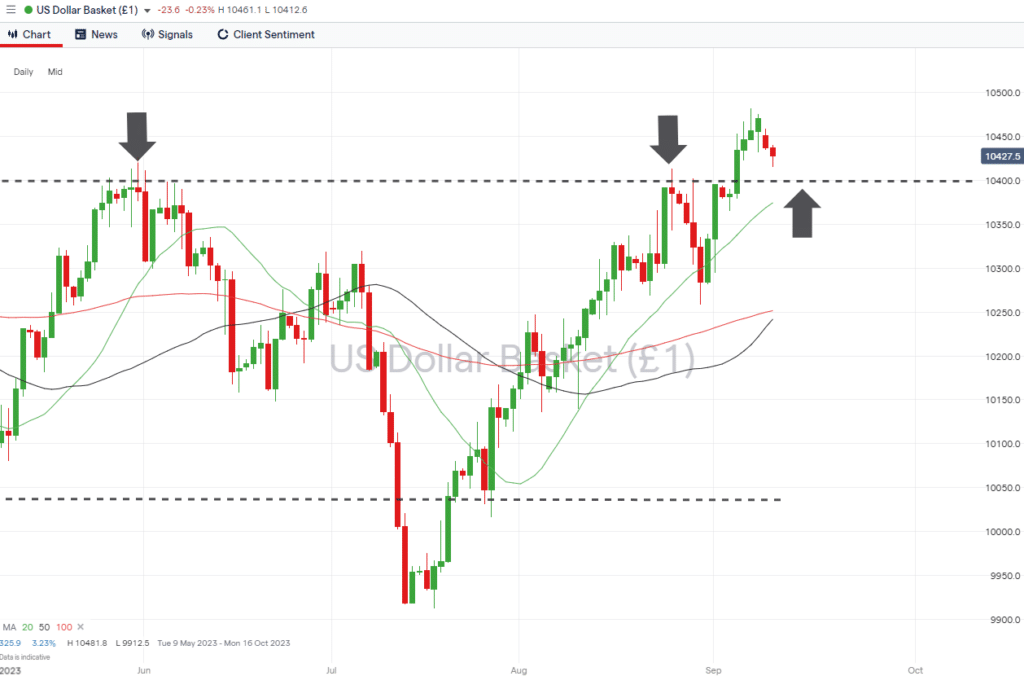
Source: IG
US Dollar Basket Chart – Hourly Price Chart
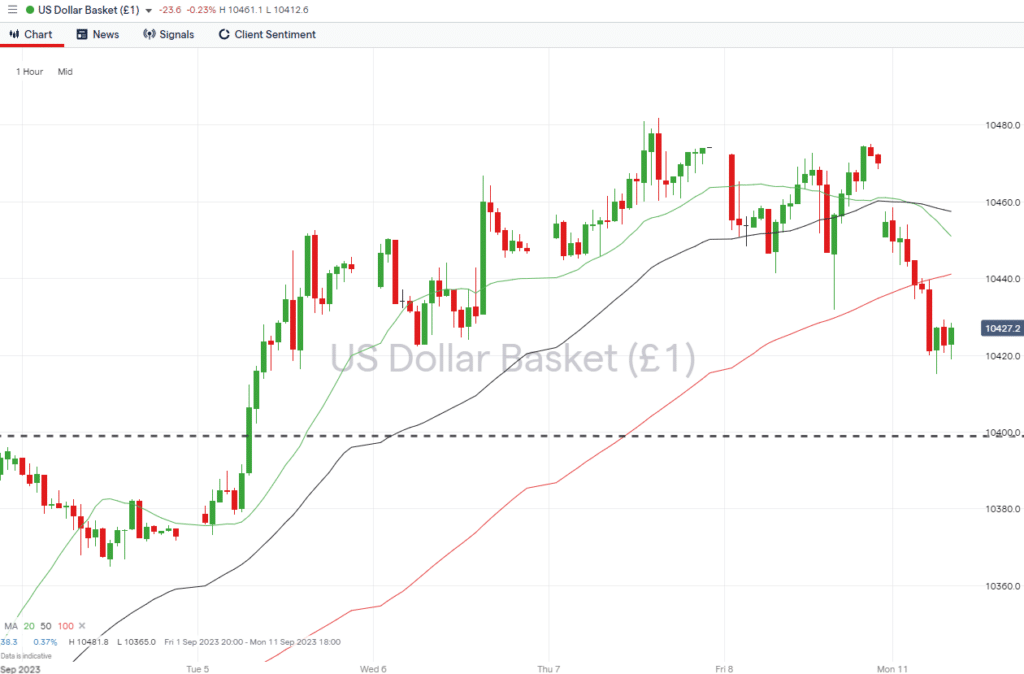
Source: IG
Short positions
- Entry Level 1: 104.81 – Price high of Thursday 7th September. With upwards momentum confirmed, those looking to open short positions would do well to enter into them at previous price highs and trade the retracement.
- Price Target 1: 104.00 – Price level that previously acted as resistance in June, July and August can now be expected to act as support.
- Price Target 2: 103.74 – The region of the 20 SMA (Simple Moving Average) on the Daily Price Chart.
- Stop Loss: > 105.48 – Intraday price high printed on Wednesday 7th March.
Long positions
- Entry Level 1: 103.94 – The upwards trend that started on 18th July is still the underlying theme of the US Dollar Basket Index market. A pull back to the level of the double top pattern would offer a chance to buy at a price level that previously acted as resistance and can now be expected to act as support.
- Price Target 1: 104.81 – Price high of Thursday 7th September.
- Price Target 2: 105.43 – Multi-month high closing price recorded on 7th March.
- Stop Loss: < 103.74 – Region of the 20 SMA on the Daily Price Chart.
GBPUSD
The downwards trend in GBPUSD that dates back to mid-July is forming a wedge pattern that is now narrowing. This could indicate a change in direction in the region of the 200 SMA on the Daily Price Chart, which can be expected to offer significant support.
Daily Price Chart – GBPUSD Chart – Daily Price Chart
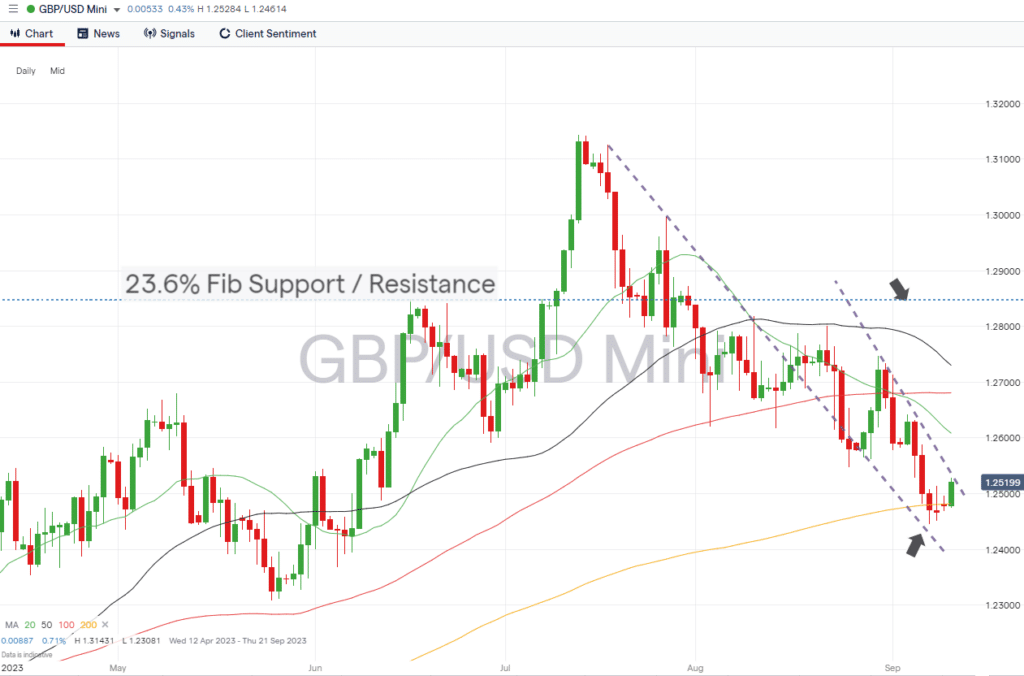
Source: IG
GBPUSD Chart – Hourly Price Chart
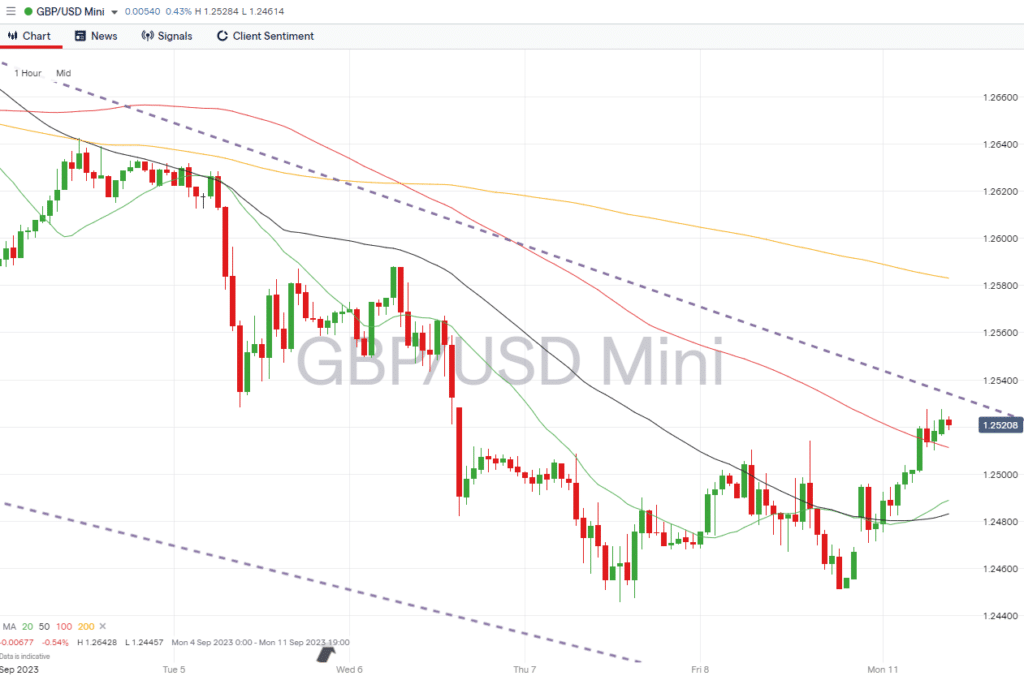
Source: IG
Short positions
- Entry Level 1: 1.24817 – A confirmed break of the 200 SMA on the Daily Price Chart would signal the build-up of significant downwards momentum.
- Price Target 1: 1.24457 – Multi-month price low of 7th September.
- Price Target 1: 1.3081 – Price low of 25th May, which now forms an important swing-low price support level.
- Stop Loss: > 1.25279 – Intraday price high of 11th September.
Long positions
- Entry Level 1: 1.24817 – While price trades above the 200 SMA on the Daily Price Chart, there remains a chance that a rebound will take place.
- Price Target 1: 1.25274 – Upper band of downwards trendline.
- Price Target 2: 1.26000 – Region of 20 SMA on the Daily Price Chart, and ‘round number’ price level.
- Stop Loss: > 1.24457 – Multi-month price low of 7th September.
EURUSD
The Eurodollar is trading below the 20, 50 and 100 SMAs on the Daily Price Chart, which can only be seen as a bearish indicator. The RSI on the daily timeframe is currently 39.3, which leaves room for further downwards price moves before the market is considered oversold.
EURUSD Chart – Daily Price Chart
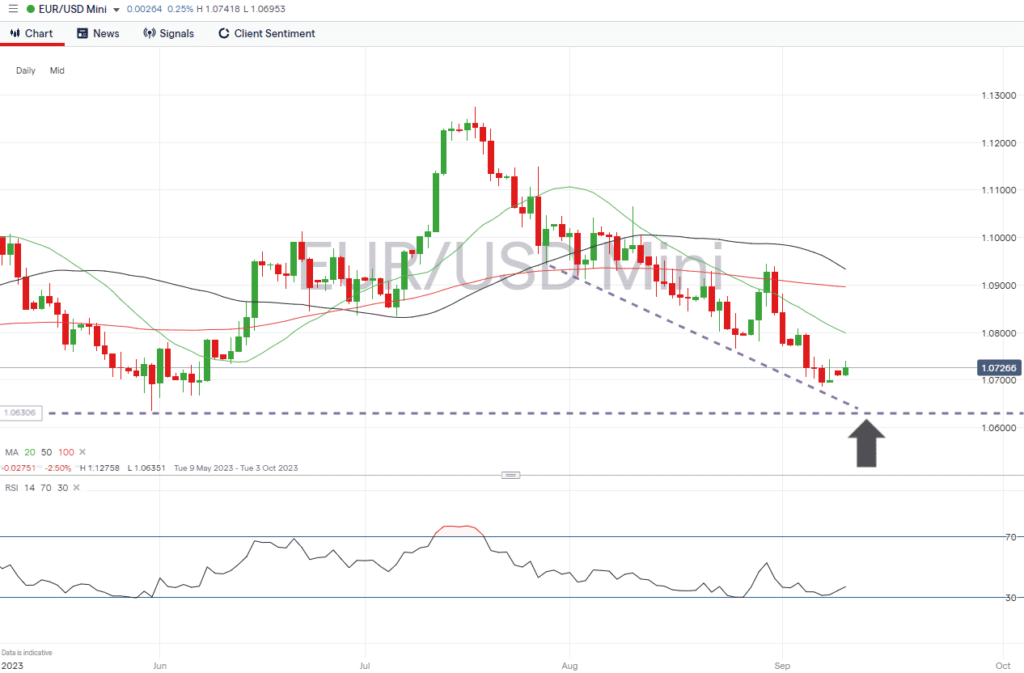
Source: IG
EURUSD Chart – Hourly Price Chart
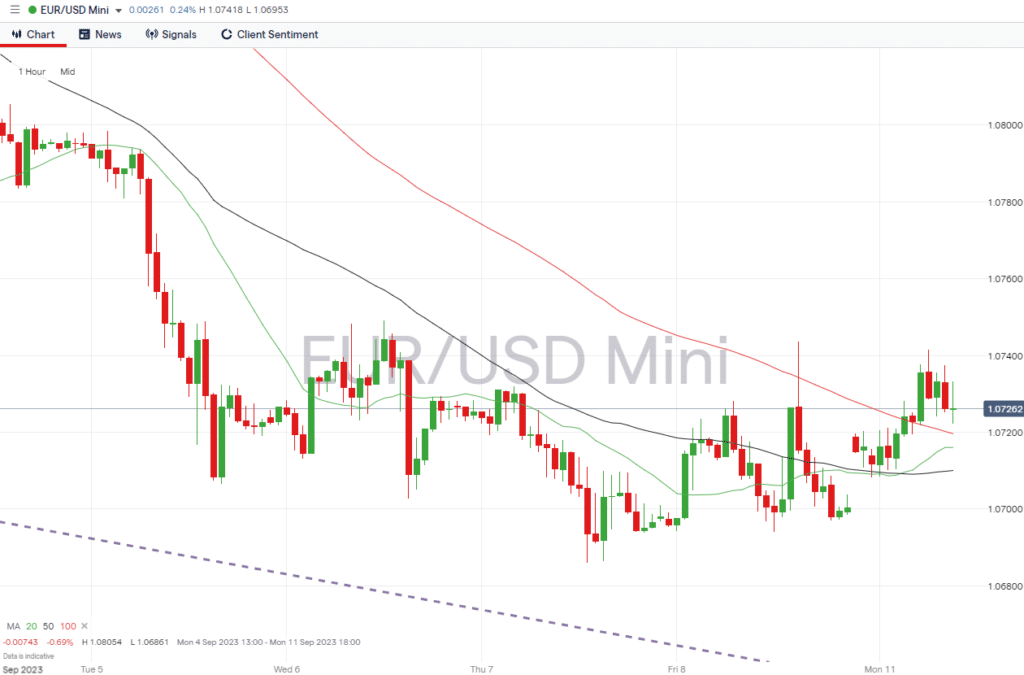
Source: IG
Short positions
- Entry Level 1: 1.07994 – Region of 20 SMA on the Daily Price Chart. With the RSI on the Daily Price Chart giving a reading of 37.1, there is room for further downwards price moves before the current trend reaches ‘oversold’ on that timeframe.
- Price Target 1: 1.06861 – Swing low recorded on 7th September.
- Price Target 2: 1.06351 – Price low of 31st May.
- Stop Loss: > 1.108963 – Region of the 100 SMA on the Daily Price Chart and round number resistance offered by the 1.0900 price bar.
Long positions
- Entry Level 1: 1.07658 – A confirmed break of the 20 SMA on the Daily Price Chart would signify a change to upwards price movement. This metric has guided the fall in value of GBPUSD that started in mid-July.
- Price Target 1: 1.0900 – The 50 and 100 SMAs are converging in the region of the psychologically important 1.09 price level.
- Price Target 2: 1.10918 – In extension, price high of 3rd May. This high, along with others recorded in the first half of the year, forms a potential double-top price pattern.
- Stop Loss: < 1.06861 – Swing low recorded on 7th September.
Indices
S&P 500
The 20 SMA on the Daily Price Chart appears to be the key metric for stock investors to watch. While this holds, there is the potential for the upwards trend that began forming in September 2022 to continue pushing upwards.
S&P 500 Chart – Daily Price Chart
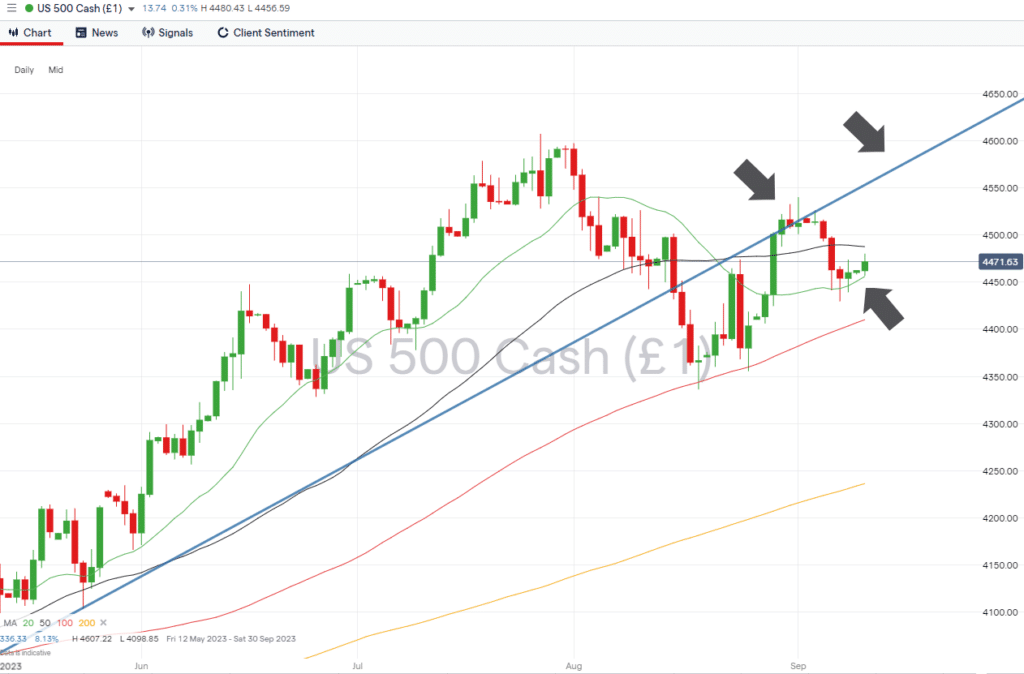
Source: IG
S&P 500 – Hourly Price Chart
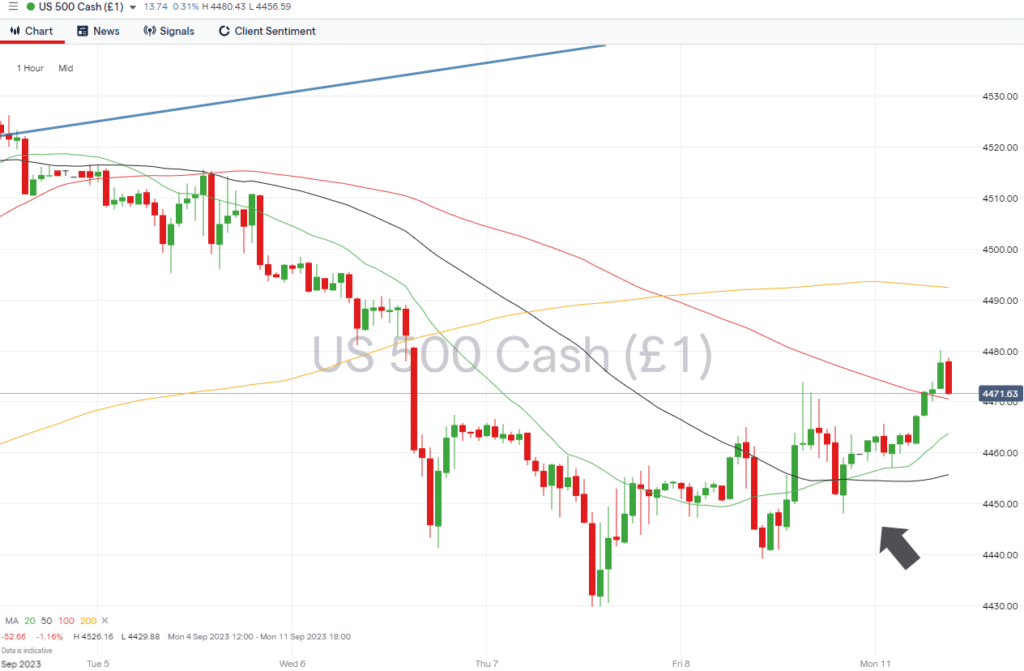
Source: IG
Short positions
- Entry Level 1: 4,456 – A break of the 20 SMA on the Daily Price Chart would point towards the downwards price action that started on 1st September becoming a more significant trend.
- Price Target 1: 4,410 – Region of the 100 SMA on the Daily Price Chart. Price has failed to close below this metric since 23rd March.
- Stop Loss: > 4,500 – Round number resistance level that sits just above the 50 SMA on the Daily Price Chart.
Long positions
- Entry Level 1: 4,456 – Applying a pull-back strategy to capture buying opportunities in the region of the 20 SMA on the Daily Price Chart.
- Price Target 1: 4,487 – Region of the 50 SMA on the Daily Price Chart.
- Price Target 2: 4,559 – Long-term trendline that previously acted as support and can now be expected to offer resistance to further upwards price moves.
- Stop Loss: > 4,410 – 100 SMA on the Daily Price Chart.
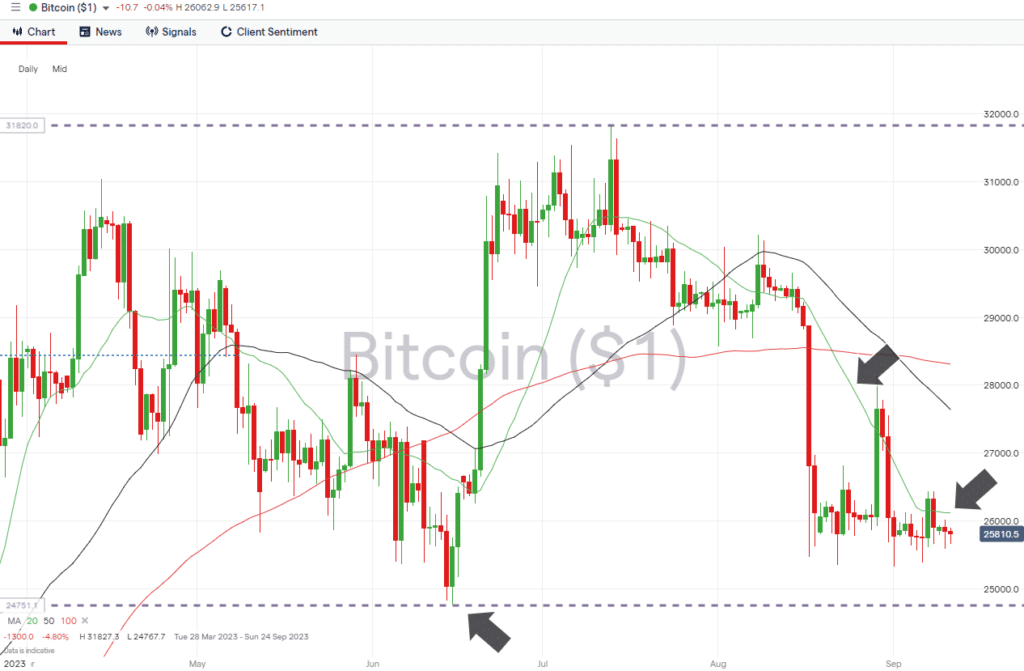
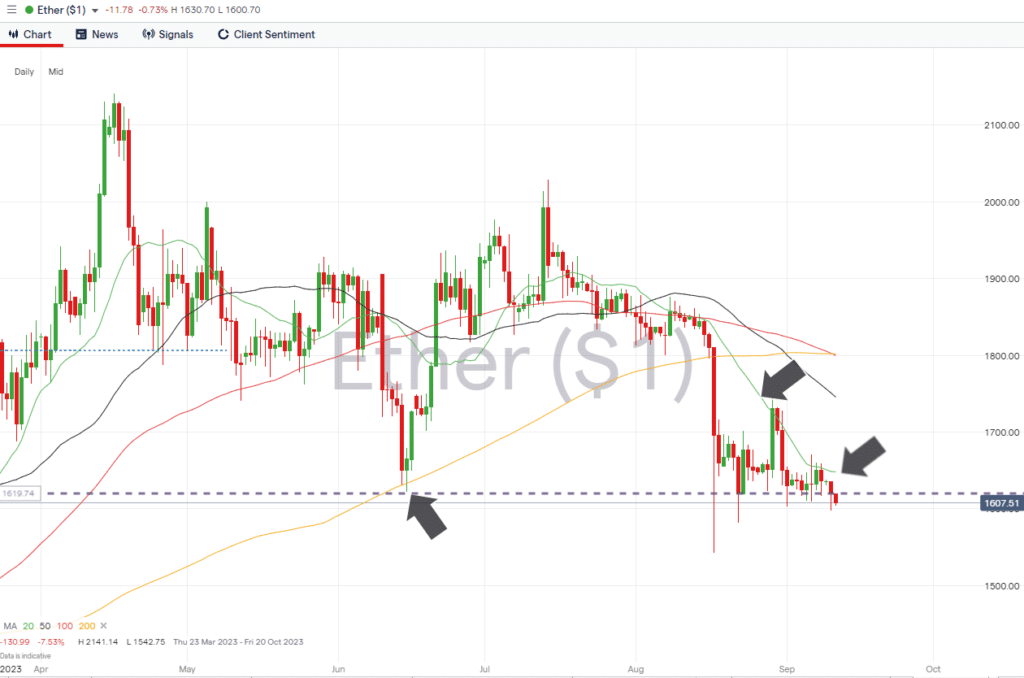
Crypto – Bitcoin & Ethereum
Both the major cryptos continue to form consolidation patterns above key support levels. A break of the 20 SMA on the Daily Price Chart would be a signal that an upwards trend is forming.
Bitcoin Price Chart – Daily Price Chart
Source: IG
Bitcoin Long positions
- Entry Level 1: 26,121 – Region of the 20 SMA on the Daily Price Chart. Traders and investors will see a confirmed break of this metric as a signal of renewed bullish sentiment.
- Price Target 1: 27,642 – Region of the 50 SMA on the Daily Price Chart.
- Price Target 2: 31,827 – In extension, current year-to-date price high printed on 13th July.
- Stop Losses: < 25,334 – Support level provided by the price low printed on 1st September.
Ethereum
Ethereum Chart – Daily Price Chart
Source: IG
Ethereum Long positions
- Entry Level 1: 1,542 – Intraday price low recorded on 17th August.
- Price Target 1: 1,647 – Region of the 20 SMA on the Daily Price Chart.
- Price Target 2: 2,000 – In extension, round number price level that previously acted as resistance on 13th and 14th July.
- Stop Losses: < 1,542 – There are few support levels below this entry point, so tight stop losses will be a popular option among traders.
Risk Statement: Trading financial products carries a high risk to your capital, especially trading leverage products such as CFDs. They may not be suitable for everyone. Please make sure that you fully understand the risks. You should consider whether you can afford to take the risk of losing your money.

Forextraders' Broker of the Month
BlackBull Markets is a reliable and well-respected trading platform that provides its customers with high-quality access to a wide range of asset groups. The broker is headquartered in New Zealand which explains why it has flown under the radar for a few years but it is a great broker that is now building a global following. The BlackBull Markets site is intuitive and easy to use, making it an ideal choice for beginners.