
FOCUS ON: Central Bank Interest Rate Decisions
- US Fed, Bank of England, and Bank of Japan to update on interest rate policy
- Inflation news out of the US last week triggered a selloff in risk-on assets
- Prices in many markets now at key support/resistance levels
Trading Ideas
We created this Weekly Tips section to share possible trade entry and exit points based on our technical analysis. We also have other methods to validate our trades which we can’t publicly share that help to increase their success. All our trades include entry and at least one target price. Stop losses are applied at the reader’s discretion. Our strategies typically trade with a wide stop loss, and risk is further mitigated by trading in small sizes.
Instrument | Price | Hourly | Daily |
GBP/USD | 1.2388 | Strong Sell | Strong Sell |
EUR/USD | 1.0663 | Strong Sell | Strong Sell |
USD/JPY | 147.62 | Sell | Strong Buy |
S&P 500 | 4,459 | Strong Sell | Sell |
NASDAQ 100 | 15,237 | Strong Sell | Sell |
FTSE100 | 7,710 | Strong Buy | Strong Buy |
Gold | 1,928 | Strong Buy | Neutral |
Crude Oil WTI | 90.74 | Strong Buy | Strong Buy |
Bitcoin | 26,703 | Strong Buy | Buy |
Ethereum | 1,632 | Strong Buy | Sell |
UTC: 09:32
US Dollar Basket Index (DXY)
All eyes will be on the interest rate decision to be made by the US Federal Reserve on Wednesday. That follows last week’s “hot” inflation report, which triggered a rush away from risk-on assets. With the 20 SMA on the Daily Price Chart now above a key resistance/support line, any hawkish action by the Fed could trigger a test of 105.51, the current year-to-date high.
US Dollar Basket Chart – Daily Price Chart
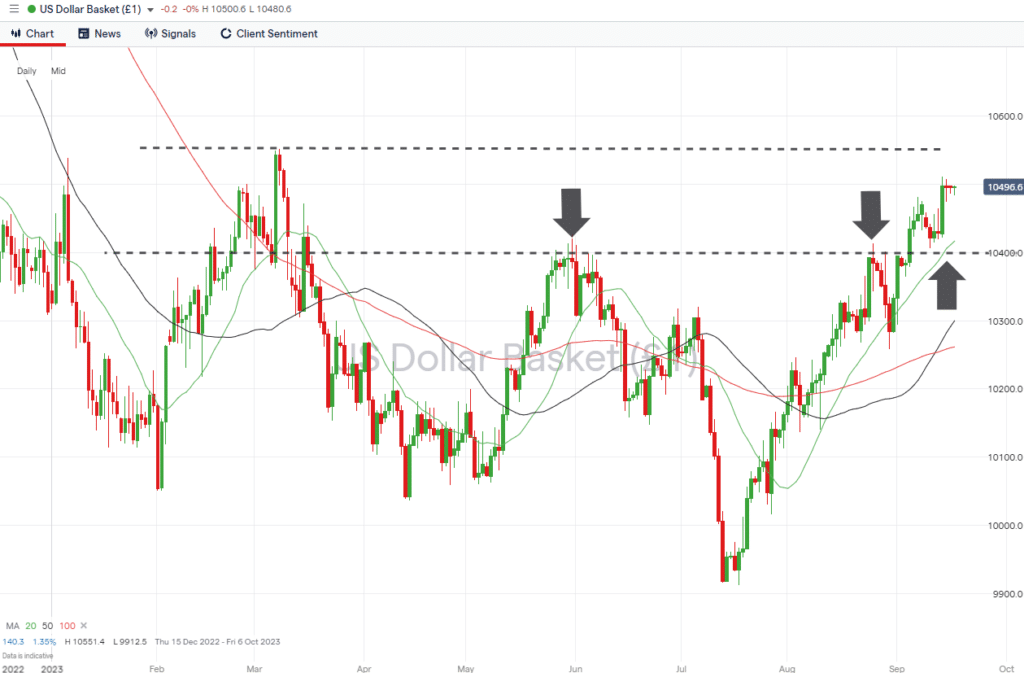
Source: IG
US Dollar Basket Chart – Hourly Price Chart
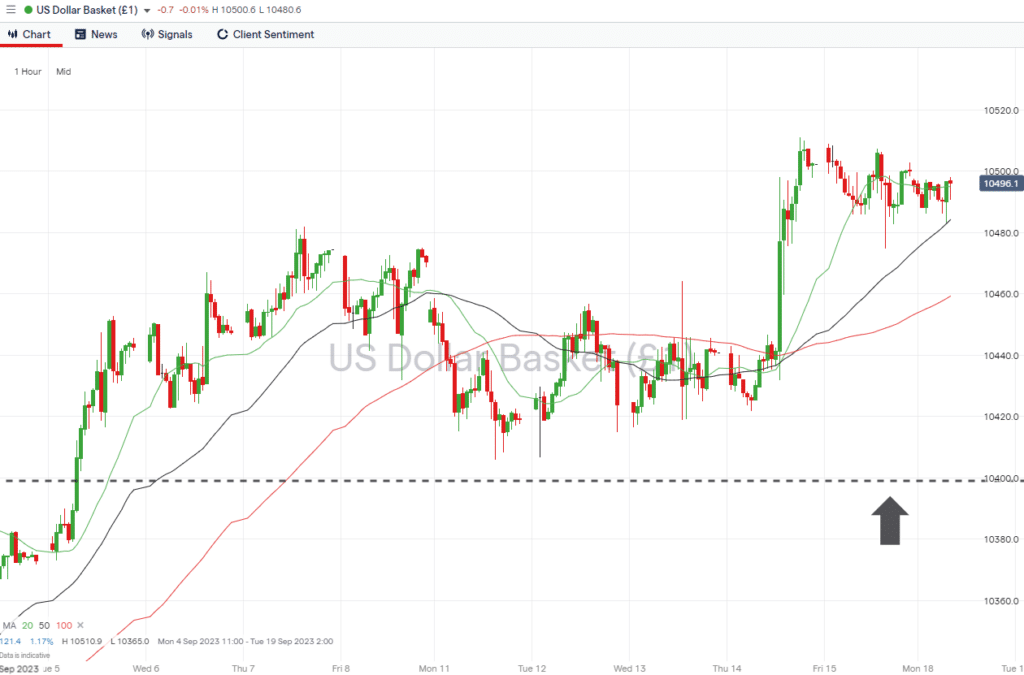
Source: IG
Short positions
- Entry Level 1: 105.51 – The year-to-date price high printed on 8th March can be expected to offer resistance to upward price moves.
- Price Target 1: 105.10 – Intraday price high of Thursday 14th September, which forms a swing-high price pattern.
- Price Target 2: 104.16 – In extension, region of the 20 SMA (Simple Moving Average) on the Daily Price Chart.
- Stop Loss: > 105.51 – Tight stop-loss as few resistance points above the trade entry point.
Long positions
- Entry Level 1: 104.16 – Region of the 20 SMA on the Daily Price Chart. The upward trend, which started on 18th July, is still the underlying theme of the US Dollar Basket Index market, but patience might be required to enter into positions at the time of a pullback.
- Price Target 1: 104.81 – Price high of Thursday 7th September.
- Price Target 2: 105.51 – In extension, year-to-date price high printed on 8th March.
- Stop Loss: < 103.94 – The upward trend, which started on 18th July, is still the underlying theme of the US Dollar Basket Index market. Level of double top price formed by the peaks of June and August.
GBPUSD
The downward trend in GBPUSD, which dates back to mid-July, continues to be the dominant theme of the ‘cable’ market.
The Bank of England is to update its interest rate policy on Thursday. That announcement is the big news announcement of the week, but with the RSI on the Daily Price Chart generating a reading of <30 since Thursday 14th September, there is room for bottom-fishers to step into an oversold market.
Daily Price Chart – GBPUSD Chart – Daily Price Chart
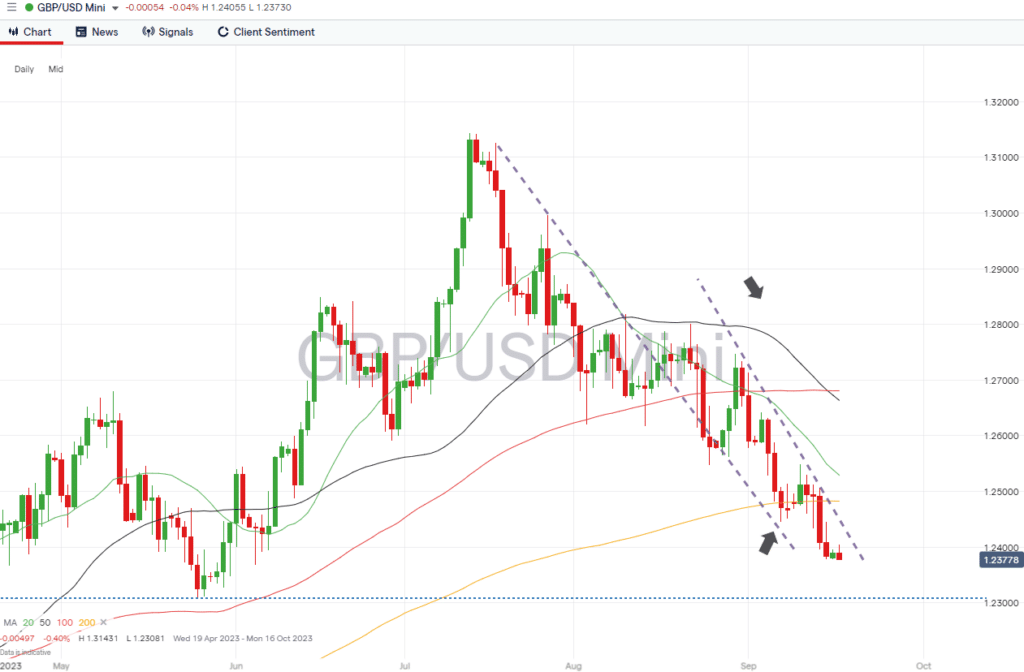
Source: IG
GBPUSD Chart – Hourly Price Chart
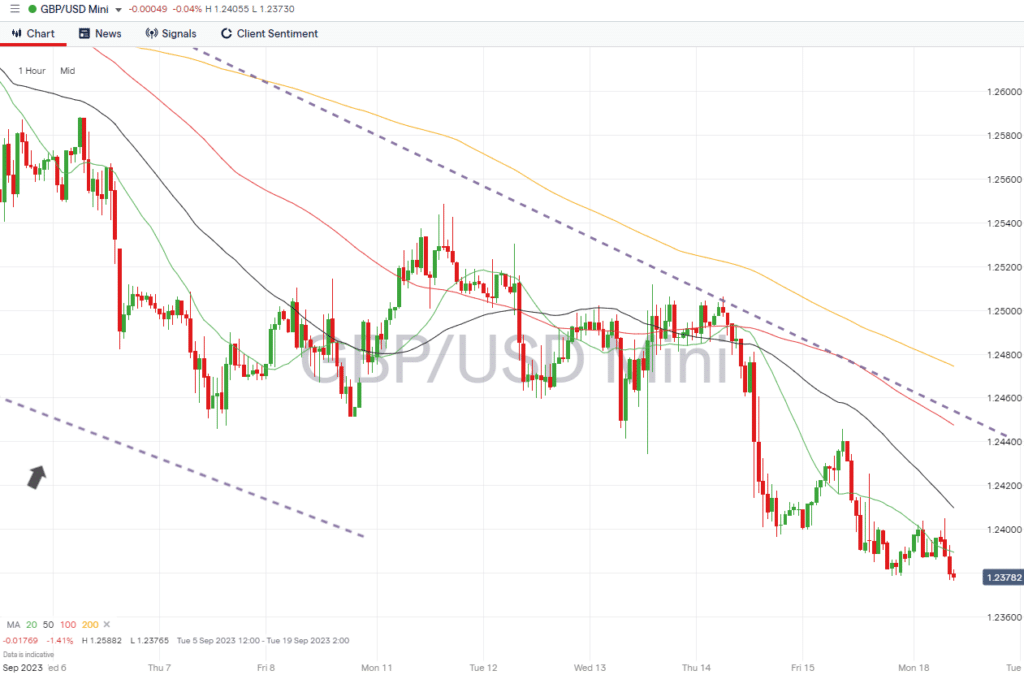
Source: IG
Short positions
- Entry Level 1: 1.24500 – Region of the upper trendline of the downward price channel.
- Price Target 1: 1.23707 – Intraday price low of 18th September.
- Price Target 2: 1.23111 – Price low of 26th May, which now forms an important swing-low price support level.
- Stop Loss: > 1.24827 – Region of the 200 SMA on the Daily Price Chart.
Long positions
- Entry Level 1: 1.23111 – 26th May swing-low price support level.
- Price Target 1: 1.2400 – Region of upper band of downward trendline and ‘round number’ price level.
- Price Target 2: 1.2500 – In extension, region of convergence of the 20 and 200 SMAs on the Daily Price Chart.
- Stop Loss: > 1.23111 – Tight stop-loss as few resistance points below trade entry point.
EURUSD
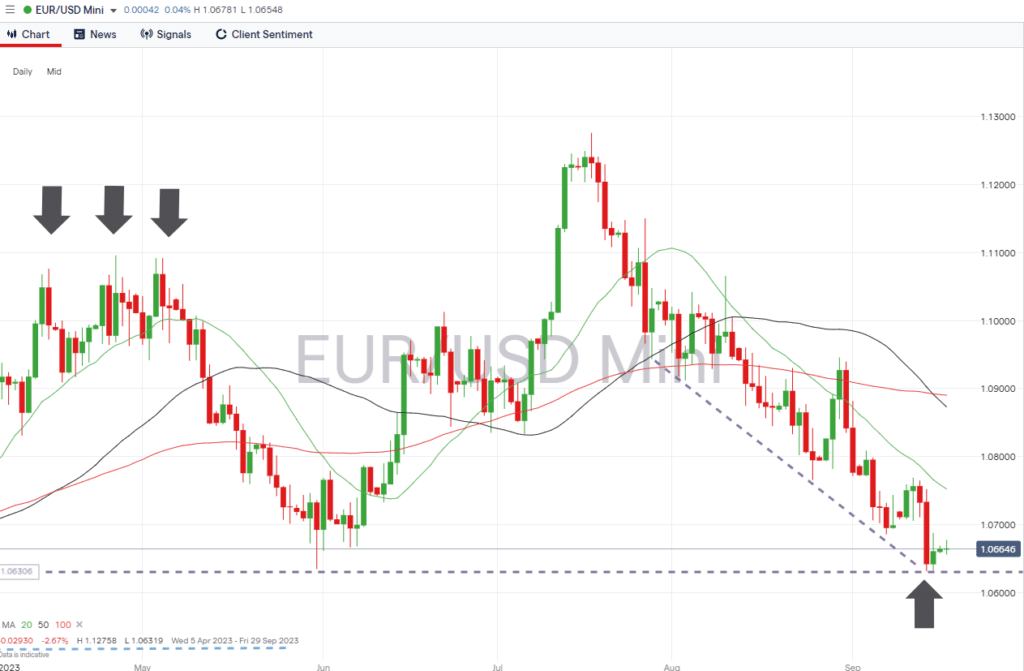
Eurodollar’s downward trend is confirmed by its trading below the 20, 50, and 100 SMAs on the Daily Price Chart, but the bounce off the 1.06351 support level is worth noting. That price level marks the low price of 31st May, which now forms a key price level.
EURUSD Chart – Daily Price Chart
Source: IG
EURUSD Chart – Hourly Price Chart
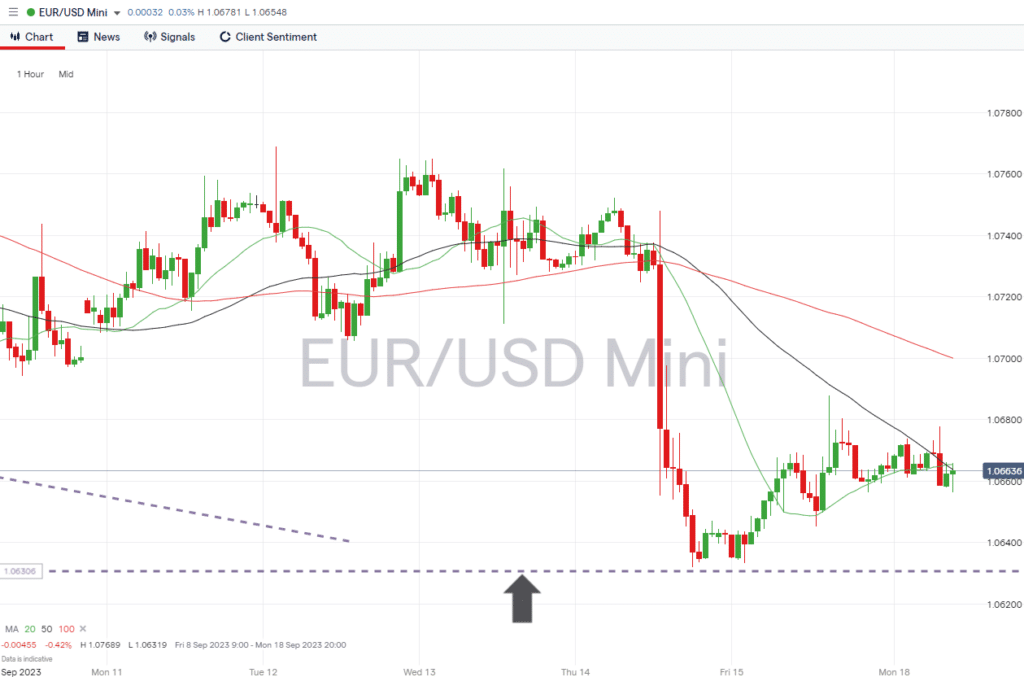
Source: IG
Short positions
- Entry Level 1: 1.06351 – A break to below the May low would open the door to further downward momentum.
- Price Target 1: 1.05163 – Area of support formed by intraday price moves on 24th February, 8th and 15th March.
- Stop Loss: > 1.0700 – Round number resistance level.
Long positions
- Entry Level 1: 1.06623 – A confirmed break of the 50 SMA on the Hourly Price Chart would signify that the bounce off the 1.6351 price level could mark a change in market sentiment.
- Price Target 1: 1.06861 – Swing low recorded on 7th September.
- Price Target 2: 1.07523 – Region of the 20 SMA on the Daily Price Chart.
- Price Target 3: 1.08730 – In extension, point at which the 50 and 100 Daily SMAs are converging.
- Stop Loss: < 1.06623 – Tight stop-loss as few resistance points below trade entry point.
Indices
S&P 500
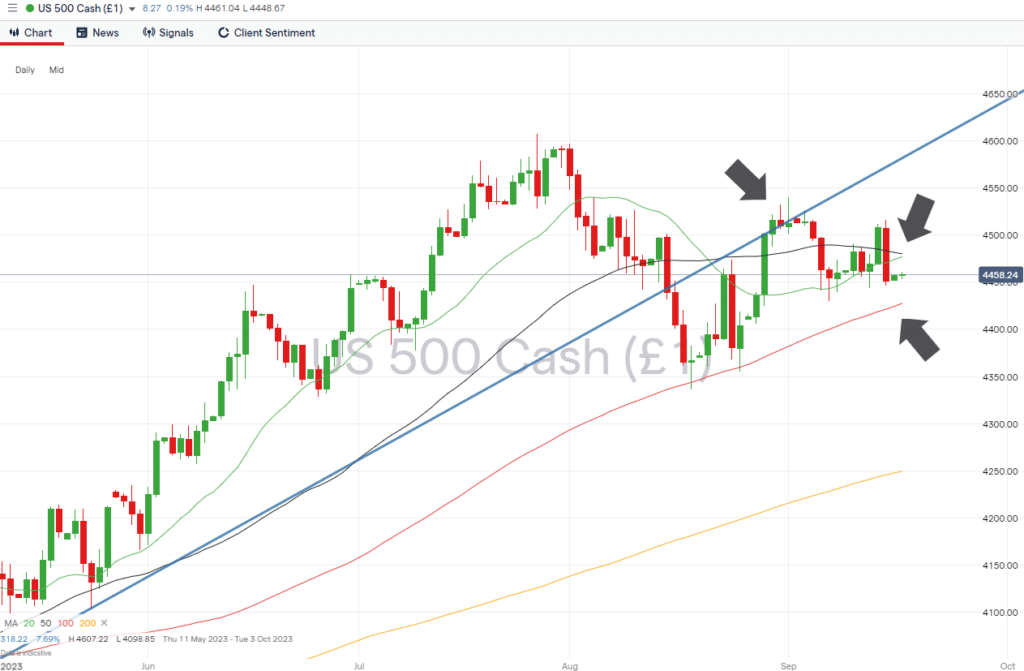
The break of the upward trend line, which dates back to September 2022, appears to be confirmed by the failed revisit to it on the 3rd of September. Price has consolidated rather than fallen away, and stocks could start the week trading in a sideways pattern, at least until the Fed’s interest rate announcement on Wednesday.
S&P 500 Chart – Daily Price Chart
Source: IG
S&P 500 – Hourly Price Chart
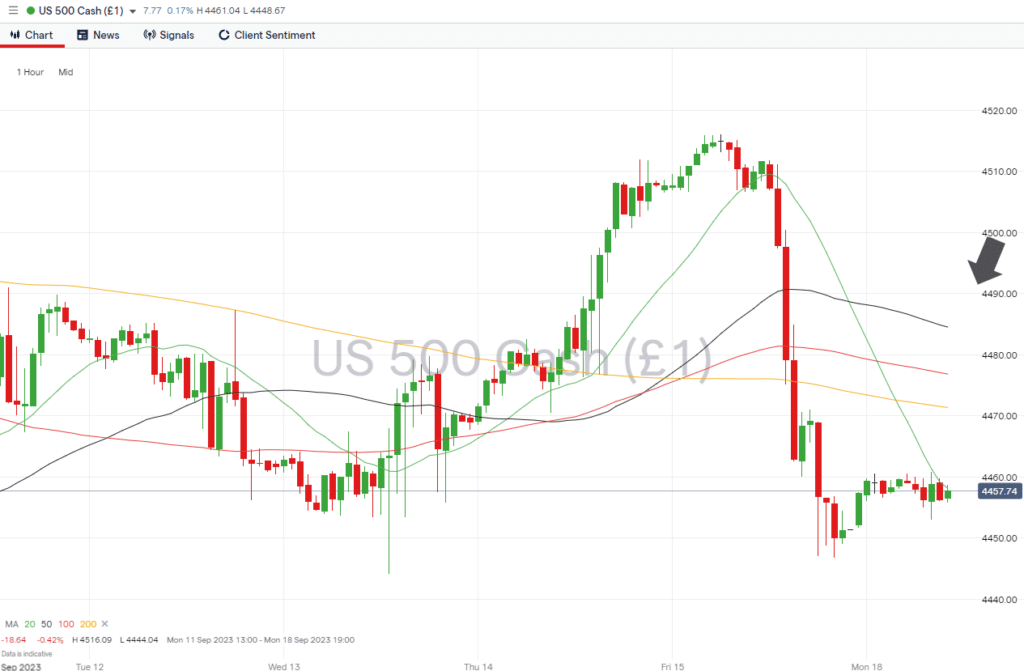
Source: IG
Short positions
- Entry Level 1: 4,476 – Area where the 20 and 50 SMAs on the Daily Price Chart are converging.
- Price Target 1: 4,427 – Region of the 100 SMA on the Daily Price Chart. Price hasn’t closed below this metric since 23rd March.
- Stop Loss: > 4,500 – Round number resistance level, which sits just below the 14th and 15th September price highs.
Long positions
- Entry Level 1: 4,427 – The 100 SMA on the Daily Price Chart appears to be the metric most likely to form the bottom of the current sideways trading channel.
- Price Target 1: 4,476 – Region of the convergence of the 20 and 50 SMAs on the Daily Price Chart.
- Price Target 2: 4,540 – In extension price high of 1st September and last time price action tested the long-term upward trendline.
- Stop Loss: > 4,400 – Psychologically significant ‘round number’ price level.
Crypto – Bitcoin & Ethereum
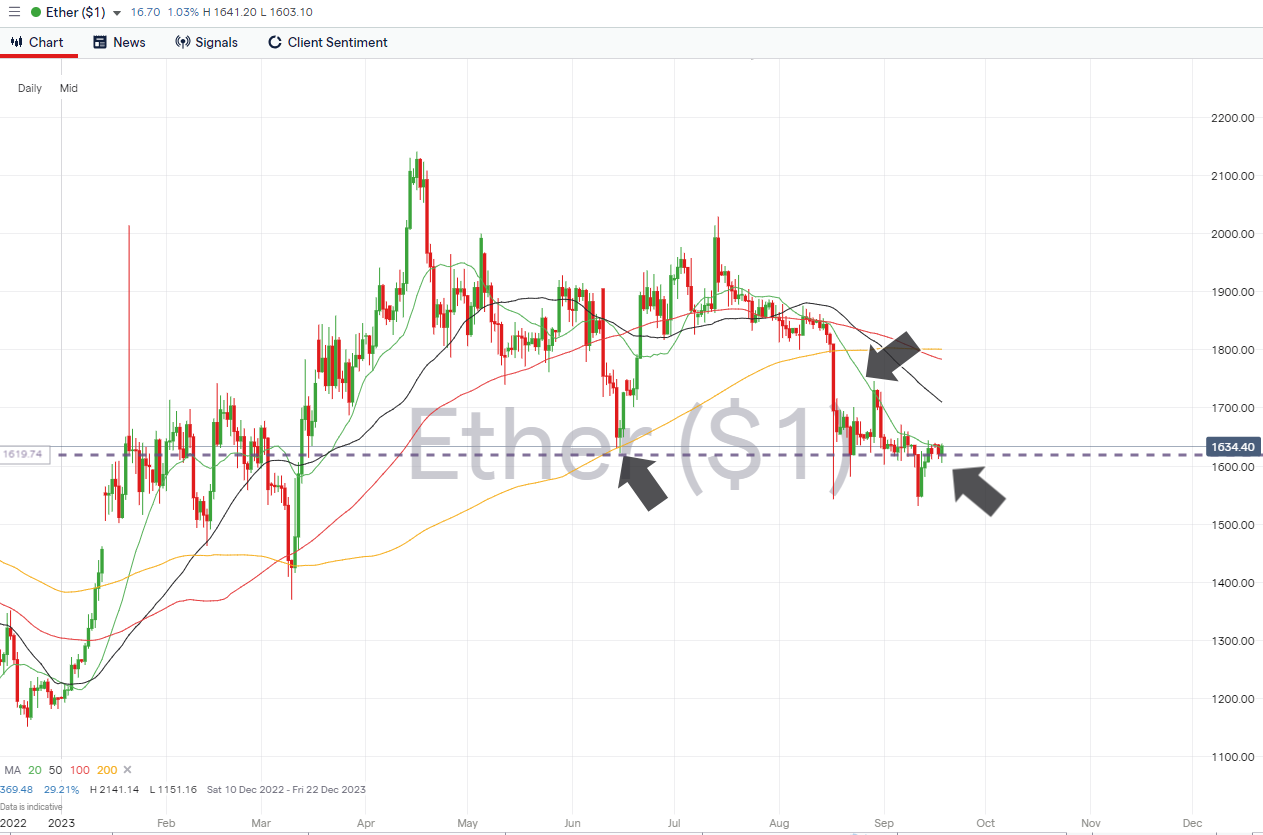
Bitcoin and Ethereum posted positive returns last week; for BTC in particular, there are signs that a new upward trend could be forming. Whilst Ethereum continues to trade below the 20 SMA on the Daily Price Chart, Bitcoin has broken through that key metric.
Bitcoin Price Chart – Daily Price Chart
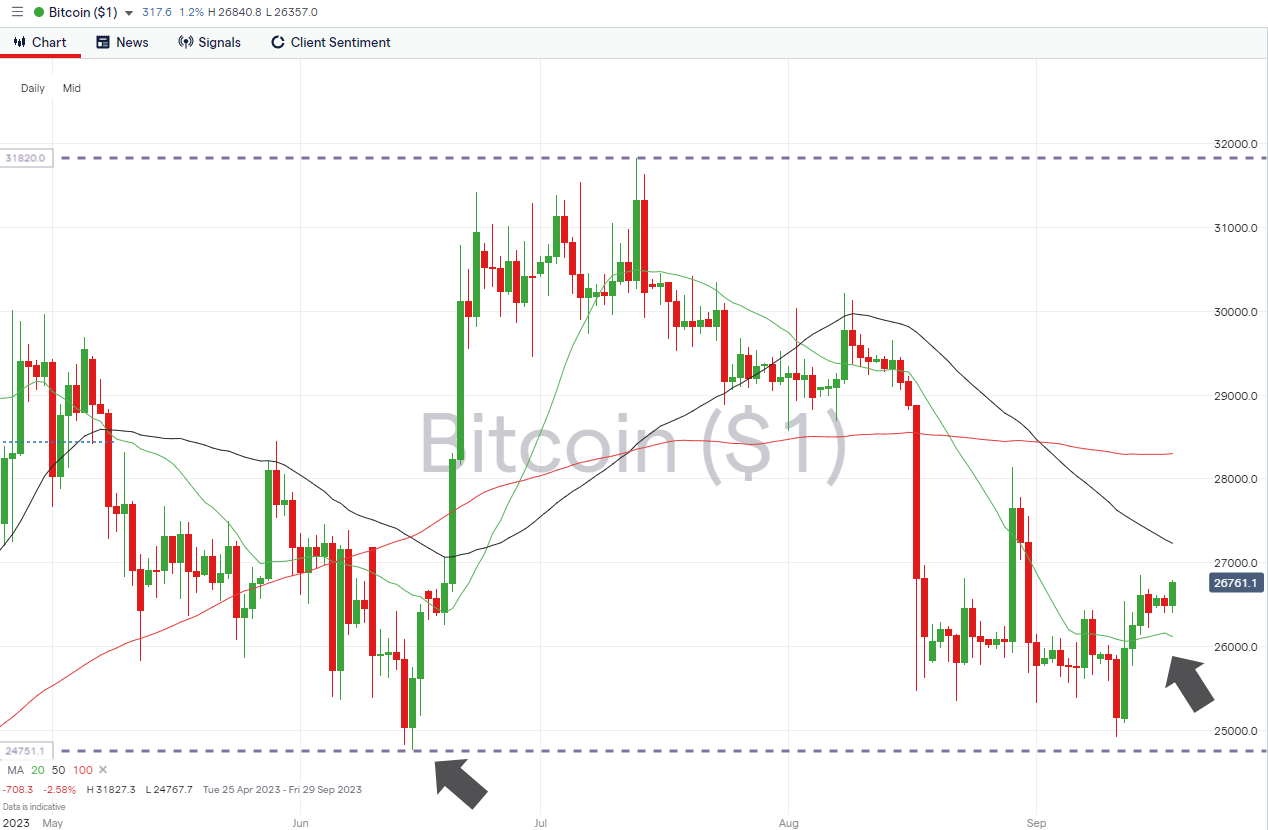
Source: IG
Bitcoin Long positions
- Entry Level 1: 26,120 – Entering into positions should price experience a short-term pullback, which retests the 20 SMA on the Daily Price Chart.
- Price Target 1: 27,232 – Region of the 50 SMA on the Daily Price Chart.
- Price Target 2: 31,827 – In extension, current year-to-date price high printed on 13th July.
- Stop Losses: < 25,334 – Support level provided by the price low printed on 1st September.
Ethereum
Ethereum Chart – Daily Price Chart
Source: IG
Ethereum Long positions
- Entry Level 1: 1,628 – Region of the 20 SMA on the Daily Price Chart. Traders and investors will see a confirmed break of this metric as a signal of renewed bullish sentiment.
- Price Target 1: 1,710 – Region of the 50 SMA on the Daily Price Chart.
- Price Target 2: 2,000 – In extension, round number price level previously acted as resistance on 13th and 14th of July.
- Stop Losses: < 1,542 – Intraday price low recorded on 17th August.
Risk Statement: Trading financial products carries a high risk to your capital, especially trading leverage products such as CFDs. They may not be suitable for everyone. Please make sure that you fully understand the risks. You should consider whether you can afford to risk losing your money.

Forextraders' Broker of the Month
BlackBull Markets is a reliable and well-respected trading platform that provides its customers with high-quality access to a wide range of asset groups. The broker is headquartered in New Zealand which explains why it has flown under the radar for a few years but it is a great broker that is now building a global following. The BlackBull Markets site is intuitive and easy to use, making it an ideal choice for beginners.