The Canadian Dollar/Indian Rupee currency pair (also referred to as CADINR and CAD/INR) is an exotic currency pair. In this article, we will examine how CADINR is performing.
CADINR Key Stats
- 2021 high: 60.97
- 2021 low: 57.20
- YTD high: 62.17
- YTD low: 58.12
- YTD % change: +4.85%
CADINR Forecast
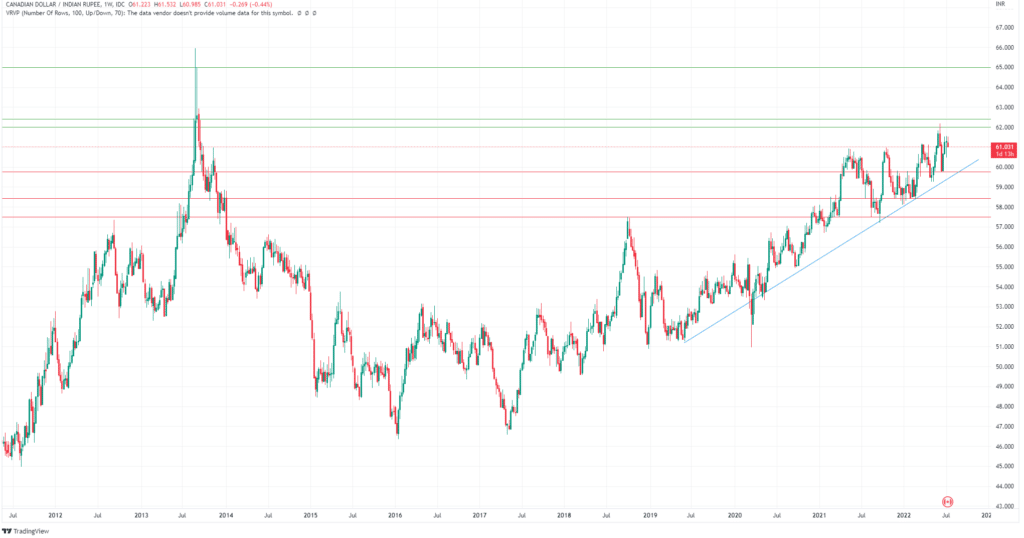
Given the macroeconomic environment, the CADINR has rallied significantly since the start of the Covid pandemic, boosted by the rise in oil prices. As a result, we expect a continued climb in the near term, with its 2013 highs looking like a real possibility. This is especially true after the BoC surprised investors with a 100bp rate hike. As a result, our near-term target is 62.40, which was tested a couple of times back in 2013, while a long-term target area is 65.00.
CADINR Fundamental Analysis
Fundamental analysis is a proven investment strategy for long- and short-term investments. Price is influenced daily by economic and fundamental factors, and it is essential to understand different economic policies in place and macroeconomic factors affecting a currency’s movement. Actions such as monetary policy, changes in unemployment, or general economic changes will impact every currency pair.
Firstly, looking into the CAD, it often reacts to the price of oil. This is due to Canada’s most significant earnings coming from the sale of crude oil. It is one of the largest producers and exporters of the commodity, and with crude oil-producing immense gains this year, the Canadian dollar has delivered excellent gains this year. Furthermore, a recent hawkish tone from the Bank of Canada has also boosted the currency this year, and the central bank recently surprised investors with a 100bp rate hike in an attempt to tame inflation.
As for the Indian Rupee, the rising import costs and growing account deficit has been the key reason for its weakness. In addition, inflation has hit India and caused its prices to rise further. This is due to India importing more than 80% of crude oil, which is its biggest import. Furthermore, oil has made significant gains this year, therefore, the weakening rupee comes as no surprise.
CADINR Technical Analysis
Support Levels:
- 59.76
- 58.43
- 57.51
Resistance Levels:
- 62.00
- 62.40
- 65.00
Support levels are areas we will be watching for any potential pullbacks. The first level that sticks out to us on longer-term charts (daily/weekly) is 59.76. This is because it has previously acted as a strong resistance and support level in the past. As for 58.43, it has also been tested many times previously, and traders will be watching any pullbacks into that area. Furthermore, more significant retracements will shift our focus to the 57.51 price level. However, it may take a little while to pull back this far, given the weakness in the rupee.
After an impressive bullish run, the pair will face some resistance levels. The first resistance level it may meet is at 62.00. It is just below the most recent swing high for the pair and is a key psychological level that traders will watch closely. Next, we have 62.40, which will be another critical level as it was tested a couple of times back in 2013. Finally, level 65.00 is another key psychological level. It will be challenging to break this high achieved in 2013, but the current bullish run may be enough to see it break through once again.
Trade CADINR with our top brokers
| Broker | Features | Regulator | Platforms | Next Step | |
|---|---|---|---|---|---|
 Your capital is at risk
Founded: 2014 Your capital is at risk
Founded: 2014 |
|
FSPR | MT4 | ||
 Your capital is at risk
Founded: 2006 Your capital is at risk
Founded: 2006Europe* CFDs ar... |
|
ASIC, FSA, FSB, MiFID | MetaTrader4, Sirix, AvaOptions, AvaTrader, Mirror Trader | ||
|
Between 74-89 % of retail investor accounts lose money when trading CFDs |
|
ASIC, FCA | MetaTrader 4, MetaTrader 5, cTrader | ||
|
|
|
ASIC, CySEC, IFSC | MT4 Terminal, MT4 for Mac, Web Trader, iPhone/iPad Trader, Droid Trader, Mobile Trader, MT5 | ||
 Your capital is at risk
Founded: 2006 Your capital is at risk
Founded: 2006 |
|
CySEC, DFSA, FCA, FSB, SIA | MetaTrader4, MetaTrader5, cTrader, FxPro Edge (Beta) | ||
|
|
|
CySEC, FSC, FSCA, MISA | MT4, MT5, OctaTrader | ||

Forextraders' Broker of the Month
BlackBull Markets is a reliable and well-respected trading platform that provides its customers with high-quality access to a wide range of asset groups. The broker is headquartered in New Zealand which explains why it has flown under the radar for a few years but it is a great broker that is now building a global following. The BlackBull Markets site is intuitive and easy to use, making it an ideal choice for beginners.