It is now time to set up your trading platform for analysis and execution of forex orders. The screen shot below is for the popular MetaTrader4 trading system, offered as standard by most all forex brokers. Let’s review the following diagram:
The MT4 charting software, or any other proprietary model for that matter, will resemble the above diagram after making a few routine initial set-up modifications. You will want to make your screen look like the above example, but do not get frustrated if it takes a while to get accustomed to working with the various aspects of the software. It will be a good learning experience – every bit of experience is an investment in the future.
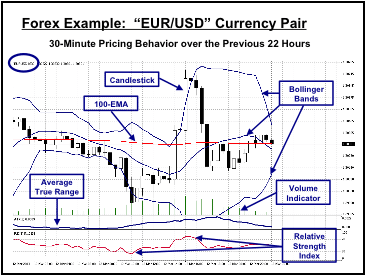
Here we have the 30-Minute chart for the “EUR/USD” currency pair (the “blue” oval in the top left corner tells you this – to adjust this parameter, use the “Periodicity” section of your Toolbar). A brief explanation of the annotated items is as follows:
- Candlestick: A pricing convention that depicts open, close, high, and low for the period (30 minutes here). A down movement is black, an up, white; Read more about candlestick charts here.
- Bollinger Bands: Statistical averages of prior pricing behavior showing the average, and one standard deviation on either side of the mean. The Bands are like an accordion. Learn to watch for expansions and contractions; Read more about the bollinger bands indicator here.
- 100-EMA: An exponential moving average of the previous one hundred periods; Read more about the EMA indicator here.
- Volume Indicator: The broker provides these green volume lines, based only upon the traffic that he sees. There is no central clearing house for forex;
- Average True Range (ATR): An indicator that reflects the average range in prices for a specific period in time; — the standard setting is for nine periods; Read more about the ATR indicator here.
- Relative Strength Index (RSI): A popular oscillating indicator that suggests when the market is overbought or oversold – the arrows note these conditions – over “70” is overbought, and under “30” is oversold. Read more about the RSI indicator here.
We now have a basis upon which to move to the next lesson. You can always adjust the standard settings, but for now, let’s keep it simple. As complex as the above diagram may seem, beginners tend to add another three or four indicators to the mix. These additions can muddy the forex waters immensely, causing a high degree of confusion. Focus on a few tools to guide your strategy development and execution for more consistent results.
More Free Forex Lessons
subscribe to get a FREE BONUS LESSON, plus course updates, trade ideas and market news - straight to your inbox

Forextraders' Broker of the Month
BlackBull Markets is a reliable and well-respected trading platform that provides its customers with high-quality access to a wide range of asset groups. The broker is headquartered in New Zealand which explains why it has flown under the radar for a few years but it is a great broker that is now building a global following. The BlackBull Markets site is intuitive and easy to use, making it an ideal choice for beginners.