The Bollinger Bands indicator, named after its creator John Bollinger, is a popular member of the “Trend” family of technical indicators. Bollinger designed his bands to measure if prices were high or low on a comparative basis with relative volatility and to discover opportunities that give investors a higher probability of properly identifying when an asset is oversold or overbought. Traders use the bands to anticipate increases and decreases in volatility that signal imminent trend changes are on the way. The Bands are regarded as a lagging indicator due to their dependence on moving averages, but the two-dimensional graphical representation is a very popular tool today.
John Bollinger, born in 1950 in Vermont, has been a champion of technical analysis and has worked tirelessly trying to bridge the various fields of technical, fundamental, behavioural, and quantitative analysis into one common theme – “rational analysis”. His thesis is to use the best performing tool in each sub-group to get the job done. He developed his namesake indicator, the Bollinger Bands, in 1978 after the advent of the first minicomputer in 1977. He often appears in televised financial news, is an accomplished trader, and is CEO of Bollinger Capital Management.
The Bollinger Bands indicator reflects upon trend information by combining a moving average with the underlying currency’s volatility. The indicator looks like an expanding and contracting envelope drawn about the pricing indicia on a typical chart. The two boundary lines represent two standard deviations of distance above and below the moving average. The Bands work best when combined with another indicator, most notably the Reserve Strength Index (RSI) or Stochastics in the forex arena.
The beauty of the Bollinger Bands tool is that its visual representation is an overlay placed upon candlestick formations and is easily interpreted in a rapidly changing market where volatility is key. Do you want to learn more about this popular indicator system? In the following sections, we will reveal how the bands are calculated, how to read their messages, build a simple strategy around them, and study a real-time application when combined with other tools.
How are the Bollinger Bands calculated?
John Bollinger, a professional trader and financial analyst, began his trading career in the options market. At that time, simple percentage bands were used in combination with an oscillator to generate signals, but John found the system flawed. He decided to combine volatility measures and statistical models to arrive at a better solution. He chose two Standard Deviations (SDs) as his boundary settings since only 5% of a Bell Curve’s transactions fall outside this measure. An occurrence outside either boundary would halve this amount or occur 2.5% of the time.
Combined with a moving average of “20” periods, the Bollinger Bands establish boundaries that are rare from a statistical perspective but common during periods of high volatility and a strong trend. The Bollinger Bands indicator is common on MetaTrader4 trading software and other proprietary systems, and the calculation formula sequence involves the following steps:
- Calculate a Simple Moving Average (SMA) of price behaviour, (the standard period setting is “20” but can be customised to suit your needs).
- Calculate an “Upper Limit” line by adding “2” standard deviations to the SMA (standard setting is “2”, but this setting can also be modified).
- Calculate a “Lower limit” line in a similar fashion as with the “Upper Limit”.
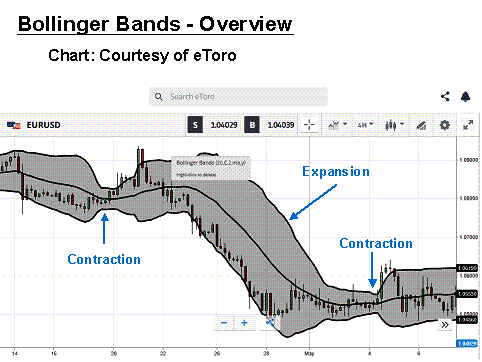
The standard default settings are used here, but Bollinger was quick to suggest that other traders experiment and arrive at a set of bands that complemented their individual trading styles. Practising on a demo system can be used for this purpose. Today’s modern software programs perform the necessary computational work and produce a set of Bollinger Bands, as displayed in the following chart for the “EUR/USD” currency pair for a 4-hour timeframe:
The Bollinger Bands indicator consists of the three fluctuating lines designated in black in the above chart. In the example above, the Upper Limit and Lower Limit Bollinger Bands encompass the candlestick formations and the black SMA or midpoint line. When the band’s contract, price consolidation is occurring, and volatility is low. As noted on the chart, these periods are typically followed by a breakout signified by expanding bands and volatility.
Over time, prices tend to move to the centreline after hugging one of the limit lines. The Upper Limit denotes resistance, and the Lower Limit represents support – valuable information that traders often use to construct their trading execution plans. The benefit of the Bollinger Bands indicator is its visual simplicity, the reason it is one of the most popular indicators and that it frequently appears in forex commentary illustrations.
How to use the Bollinger Bands in forex trading
Why Bollinger Bands work is because probabilities are brought to the task and are working in your favour. When candlesticks hug either a top or bottom boundary limit, you are witnessing occurrences that will only happen 5% of the time. The odds increase with the time that the price behaviour will break stride and return to the prevailing SMA. Trading strategies can be developed around this fact, but the Bollinger Bands have so much more information to give.
The Bollinger Bands in the above overview chart are constructed with a Simple Moving Average with a period setting of “20”, surrounded by two limit lines two standard deviations away from the SMA. These bands are comprised of the three “Black” lines presented in the above 4-Hour chart for the “EUR/USD” currency pair. In the example above, a contraction of low volatility soon breaks down when a strong downward trend commences. Expansion takes place, and, over time, the candlesticks converge on the centreline, signifying a period of consolidation and low volatility as they contract once more.
The critical points of reference are band bounces and squeeze reactions. The “Bollinger Bands Accordion” reflects how volatility varies with price behaviour. When the candlesticks hug one boundary limit, they tend to bounce back to the centreline. When the bands squeeze, they also tend to expand quickly after that as a price breakout follows a consolidation.
Bollinger was also quick to point out that when prices tag a boundary, it is not an immediate buy or sell signal, but the tagging process can continue when a strong trend is in place. This period is a time for patience. The signal occurs when prices move away from the boundary and react with the SMA.
Significant studies have also been conducted on how the Bands work in tandem with Double-Top (M-Top) and Double-Bottom (W-Bottom) pattern formations. Much of this work has been performed with stocks, which behave differently than forex pairs. With stocks, a Double-Bottom is more significant than a Double-Top, but no such delineation exists with currency pairs. The general thinking is that a breakout may be imminent when a W-Bottom or M-Top occurs within the bands while bouncing back and forth from north and south boundaries.
As with any technical indicator, a Bollinger Bands chart will never be accurate 100% of the time. False signals can occur, but the positive signals are consistent enough to tip the odds in favour of the forex trader. Skill in interpreting and understanding Bollinger Band signals must be developed over time, and complementing the Bollinger Bands tool with other indicators, especially with an oscillator, is always recommended for further confirmation of potential trend changes.
Related Articles
A simple Bollinger Bands trading strategy
Experienced traders focus on the key points of reference for the Bollinger Bands, which are band bounces and squeeze situations. Special attention must be paid when the candlesticks suddenly hug one boundary limit. When they continue to traverse this extreme, it is only a matter of time before they bounce back to the centreline. Opportunities are in the offing.
Let’s revisit the overview “EUR/USD” 4-Hour chart, with a few additional indicators for confirmation. In the chart below, we have added an exponential moving average with a “10” setting, the “Red” line within the Bollinger Bands, and a Relative Strength Index (RSI) indicator in the bottom portion of the chart. The quicker EMA will highlight imminent trend changes, and the RSI oscillator will help specify optimal entry and exit positions.
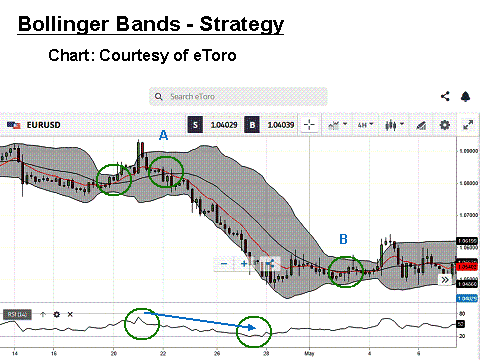
A simple Bollinger Bands strategy takes advantage of the “hug and bounce” nature of the indicator. Your entry point is best determined with the aid of another indicator, but your closing point will be after prices bounce off a boundary and then approach or close above or below the midline. In the above case, we have a classic “head fake” after the contraction, followed by a strong downtrend. The inserted EMA and RSI will help with entry, and the RSI will signal when to look for a favourable point to close the position.
The following trading system is for educational purposes only. Technical analysis can be a great asset in forex trading, but it is not without faulty signals. The first Green circle on the chart has a crossover of the two MAs, but the RSI is not confirming the direction. It is a “head fake”. The RSI soon signals a downward trend, and the third green circle has a close below the midline, followed by another MA cross.
A simple trading system would then be:
- Determine your entry point after a “squeeze” of consolidation occurs after the RSI confirms direction and when the candlesticks close below the midline.
- Execute a “Sell” order for no more than 2% to 3% of your account.
- Place a stop-loss order at 60 “pips”, roughly 2 SDs, above your entry point.
- When the RSI signals oversold, begin to look for a favourable closing point.
- Determine your exit point when candlesticks bounce from the lower boundary and close above the centreline.
Steps “2” and “3” represent prudent risk and money management principles to ensure that your downside risk potential is controlled and that a severe loss will not destroy your account balance. This simple trading system would have yielded a profit of roughly 300 pips but do remember that not all trades will behave as expected. There are no guarantees.
The Best Forex Demo Accounts
To master the Bollinger Bands it is important that you practice using it. Reading the signals the indicator gives and correctly timing your entry and exit points are skills that need to be mastered in order to maximise your profits. This is where a forex demo account comes in: It allows you to practice your new strategy without risking any of your hard-won capital. Below we have picked out some of our favourite forex demo accounts to help you out.
| Broker | Features | Regulator | Platforms | Next Step | |
|---|---|---|---|---|---|
 Your capital is at risk
Founded: 2014 Your capital is at risk
Founded: 2014 |
|
FSPR | MT4 | ||
 Your capital is at risk
Founded: 2006 Your capital is at risk
Founded: 2006Europe* CFDs ar... |
|
ASIC, FSA, FSB, MiFID | MetaTrader4, Sirix, AvaOptions, AvaTrader, Mirror Trader | ||
|
Between 74-89 % of retail investor accounts lose money when trading CFDs |
|
ASIC, FCA | MetaTrader 4, MetaTrader 5, cTrader | ||
|
|
|
CySEC, FSC, FSCA, MISA | MT4, MT5, OctaTrader | ||
|
|
|
ASIC, CySEC, IFSC | MT4 Terminal, MT4 for Mac, Web Trader, iPhone/iPad Trader, Droid Trader, Mobile Trader, MT5 | ||
 Your capital is at risk
Founded: 2006 Your capital is at risk
Founded: 2006 |
|
CySEC, DFSA, FCA, FSB, SIA | MetaTrader4, MetaTrader5, cTrader, FxPro Edge (Beta) | ||
Example of a Bollinger Bands strategy trade
For another real-time trading example, let’s look at a typical day trading opportunity. With this style, your goal is to open and close within one 8-hour period, leaving no positions open overnight. The chart below is for the “EUR/GBP” currency pair on a 1-hour timescale:
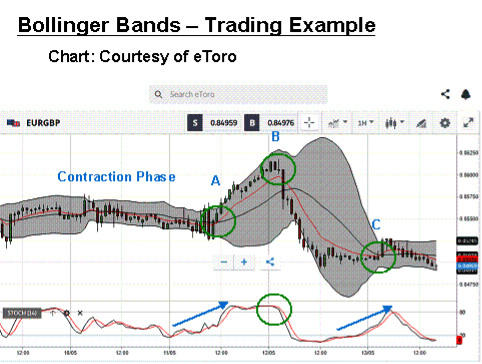
We have replaced the RSI with Stochastics, which tend to be more responsive in trending situations in the forex space. We know that the Contraction Phase will end in a breakout, but we do not know when or in what direction. The slope of the Stochastics hints at the direction, and the MA cross says “Buy” at Point “A”. The tide quickly shifts. The Stochastics suggest a “Close” and go short at point “B”. The slope of the Stochastics and squeezing bands signal a close at “C”.
These two trades would have resulted in 60 and 110 pips, respectively. When combining indicators to form an overall trading system, the trader must invest sufficient time in a practice demo system to learn how the tools work best together in tandem. There are no shortcuts to experience and expertise.
Conclusion
The Bollinger Bands indicator explained above has become one of the most popular indicator systems ever invented, and for good reason. They are very flexible. Bollinger Bands are displayed directly with the chart pricing data, and its messages are easy to comprehend. It is no wonder that it is the first complex indicator that many beginners learn about and then develop trading strategies around.
As simple as these concepts and trading strategies might seem, a wise trader knows that a good deal of practise on a demo system is warranted to learn the nuances of this indicator and how statistical modelling will always force activity back to a mean or average value. Like with all indicators, use the Bands in combination with another one or two companion indicators for complete confirmation of signals and gain the edge you need to succeed in the market.

Forextraders' Broker of the Month
BlackBull Markets is a reliable and well-respected trading platform that provides its customers with high-quality access to a wide range of asset groups. The broker is headquartered in New Zealand which explains why it has flown under the radar for a few years but it is a great broker that is now building a global following. The BlackBull Markets site is intuitive and easy to use, making it an ideal choice for beginners.