
- The release of Fed minutes and US CPI inflation data will offer insight into the likelihood of further interest rate rises before the end of the year.
- Those announcements come as increased volatility in the market provides trading opportunities for both bulls and bears.
- Chinese inflation data and UK GDP figures are also due to be released and could impact prices in currency markets.
- Earnings season kicks off in the US, with big banks updating investors on Friday.
Last week’s impressive US jobs growth numbers have offered hope to bulls who can, with some justification, suggest that the recent sell-off in risk assets could be overdone, at least on a short-term basis. At the same time, bears can point to the underlying trend being a move toward more defensive assets. That leaves the markets in something of a sweet spot for traders with increased levels of price volatility, creating trading opportunities for those looking to enter into both long and short positions.
A busy week in terms of news flow means there will be plenty of announcements that could trigger price moves. The numbers to look out for include the US inflation report, the release of the minutes of the Fed’s last meeting, Chinese inflation data, and UK GDP figures.
US Dollar
The US dollar’s upward trajectory remains intact, but the fallback from a mid-week price spike left the greenback posting a modest loss last week. That resulted in the US Dollar Basket index posting a red weekly candle for the first time since July 17th, with the inverted hammer nature of the candlestick being able to be interpreted as a bearish signal. The trigger for renewed risk appetite was Friday’s US Non-Farm Payrolls jobs report, which showed payrolls soared by 336,000. That figure beat analyst expectations, with the consensus jobs growth prediction having been a much lower 170,000.
Short-term exuberance will be tested by a series of reports due to be released this week. They will shed light on the state of the US economy and offer clues as to the Fed’s next steps in terms of interest rate policy. On Wednesday, the US PPI inflation numbers and Fed minutes are released, with those reports being followed by the crucial US CPI report on Thursday and the Michigan Consumer Confidence report on Friday.
Two other factors need to be considered. The first is the start of earnings season, with big banks JPMorgan Chase, Wells Fargo, and Citigroup releasing their quarterly earnings reports on Friday. The second is the escalation of the Israel-Palestine conflict which occurred over the weekend and could trigger spikes in crude oil prices and increased volatility across the wider market.
US Dollar Basket Index – Weekly Price Chart – Inverted Hammer Candlestick
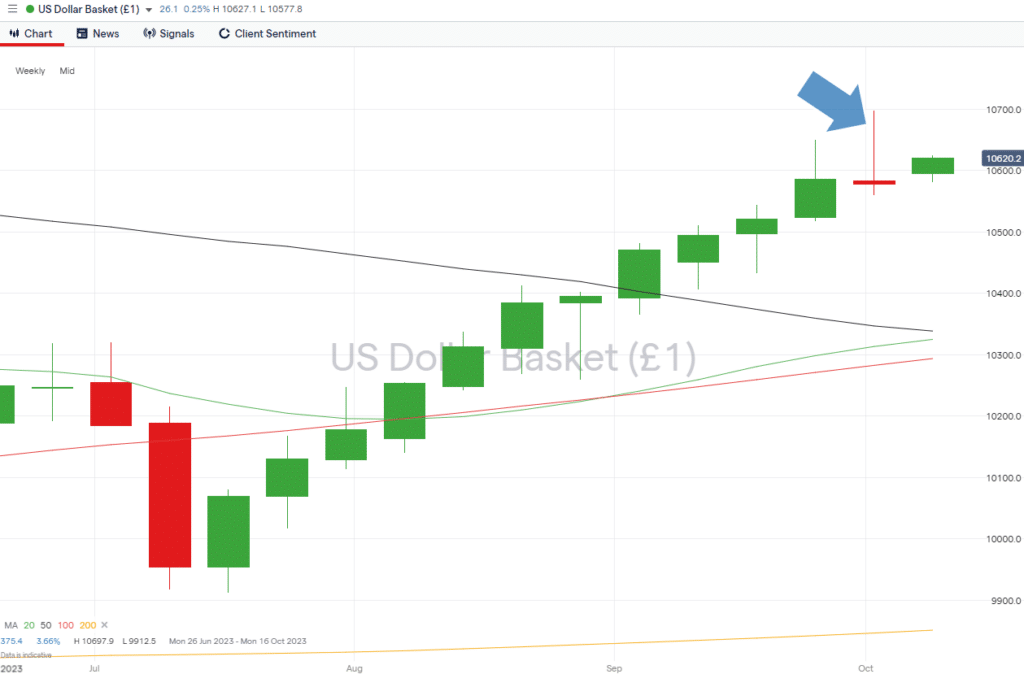
Source: IG
- Key number to watch: Thursday 12th October 1:30 pm (BST) – US CPI (September), analysts forecast prices to rise 0.4% month-on-month and 3.8% year-on-year, from 0.6% and 3.7%, respectively.
- Key price level: 105.73. 20 SMA on the Daily Price Chart – price hasn’t closed below this support level since 30th August.
EURUSD
The absence of euro-specific news announcements doesn’t mean it will be a quiet week for traders of the euro-dollar currency pair. Inflation data and Fed minutes due out of the US can be expected to trigger moves in EURUSD, with price currently trading mid-range between two key support and resistance levels.
Daily Price Chart – EURUSD – Daily Price Chart – Support and Resistance
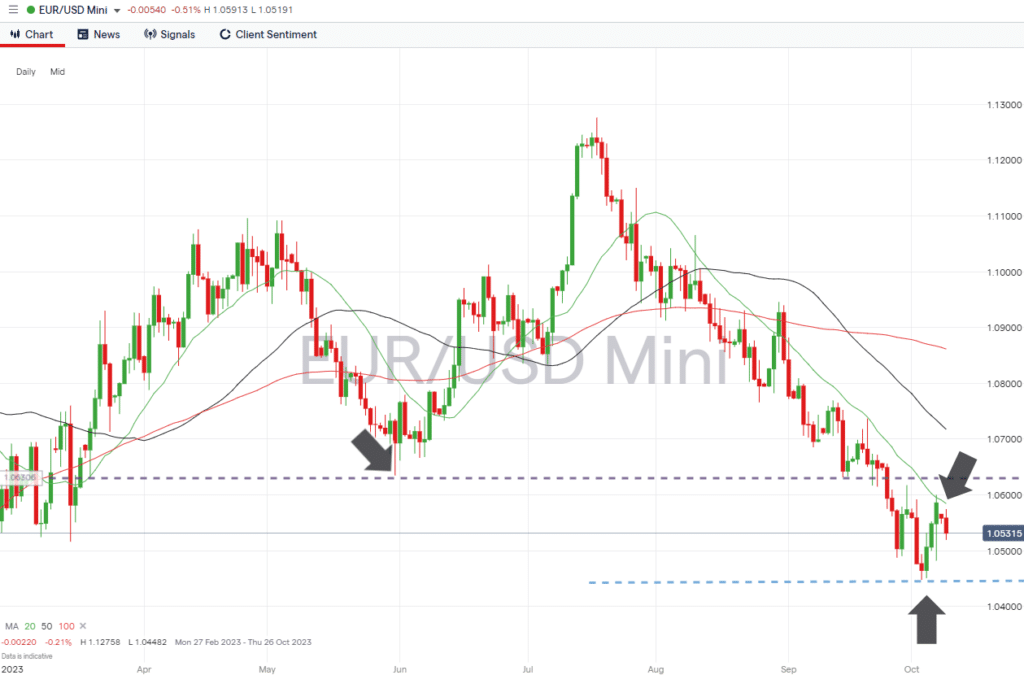
Source: IG
- Key number to watch: Thursday 12th October 1:30 pm (BST) – US CPI (September), analysts forecast prices to rise 0.4% month-on-month and 3.8% year-on-year, from 0.6% and 3.7%, respectively.
- Key price levels: Support offered by 1.04482 – the new year-to-date low printed on Tuesday 3rd October. Resistance to upward price moves formed by the 20 SMA on the Daily Price Chart, currently trading in the region of 1.05845.
GBPUSD
The potential for a bounce in GBPUSD was highlighted in this report, which identified the RSI trading at <30 on the Daily Price Chart, indicating that the market was oversold on that timeframe. The 1.86% gain in the value of GBPUSD recorded between the 4th and 6th October took price above one key resistance level, the downward trend line dating back to 31st August, but failed to break the resistance offered by the 20 SMA on the Daily Price Chart.
With UK GDP figures due to be announced on Thursday, there are plenty of trading opportunities for those who see this as a breakout to the upside or that the longer-term downward trend will be re-established.
Daily Price Chart – GBPUSD – Daily Price Chart – Breakout?
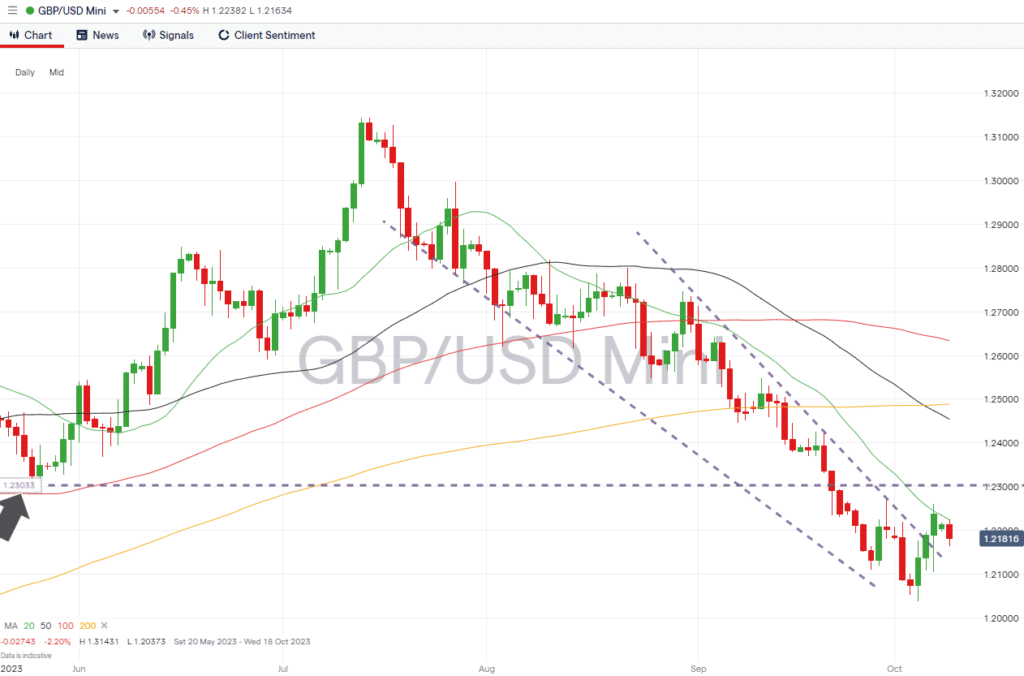
Source: IG
- Key number to watch: Thursday 12th October, 7:00 am (BST) – UK GDP (August), analysts predict growth to be -0.1% month-on-month.
- Key price levels: Support offered by new multi-month low of 1.20373 and resistance in the form of the 20 SMA on the Daily Price Chart, currently trading in the region of 1.22243.
USDJPY
Yen-based currency pairs are likely to be impacted by the US inflation report and the release of the Fed minutes, but the Chinese CPI and PPI inflation reports due on Friday can also be expected to trigger price moves.
USDJPY – Daily Price Chart
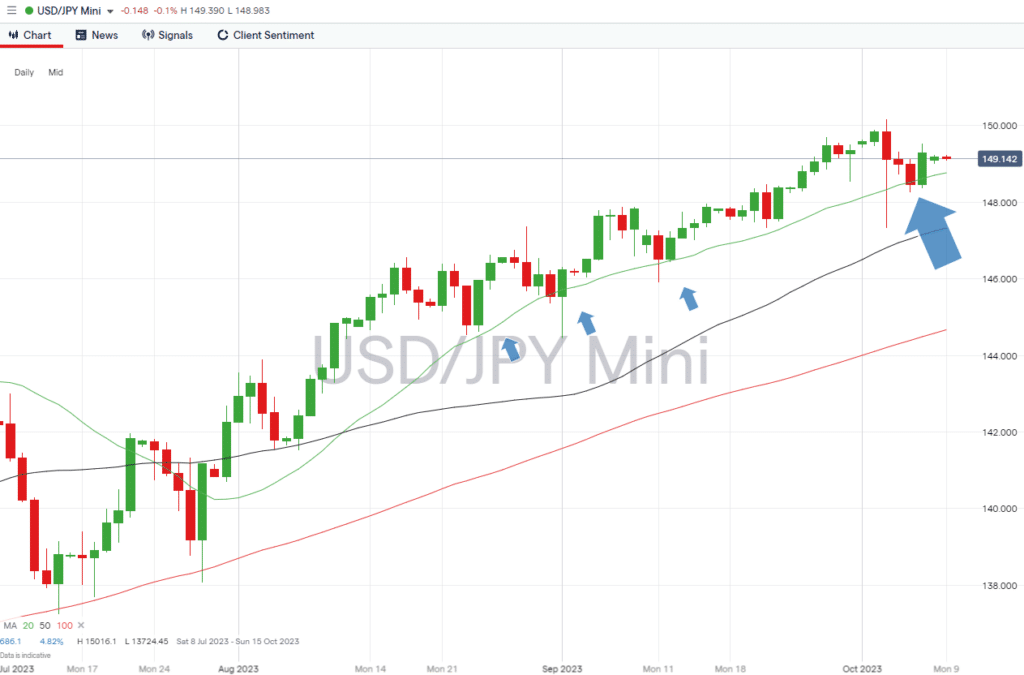
Source: IG
- Key number to watch: Friday 13th October, 2:30 am (BST) – China CPI and PPI. CPI expected to be 0.4% month-on-month and 0.2% year-on-year. PPI forecast to recover to -1% from -3% year-on-year.
- Key price levels: 148.462 – The closing price of 5th October, the first close below the 20 SMA on the Daily Price Chart since 31st August. Resistance at 15.0161 – new year-to-date price high recorded on 3rd October.
Trade EURUSD with our top brokers:
| Broker | Features | Regulator | Platforms | Next Step | |
|---|---|---|---|---|---|
 Your capital is at risk
Founded: 2014 Your capital is at risk
Founded: 2014 |
|
FSPR | MT4 | ||
 Your capital is at risk
Founded: 2006 Your capital is at risk
Founded: 2006Europe* CFDs ar... |
|
ASIC, FSA, FSB, MiFID | MetaTrader4, Sirix, AvaOptions, AvaTrader, Mirror Trader | ||
|
Between 74-89 % of retail investor accounts lose money when trading CFDs |
|
ASIC, FCA | MetaTrader 4, MetaTrader 5, cTrader | ||
|
|
|
ASIC, CySEC, IFSC | MT4 Terminal, MT4 for Mac, Web Trader, iPhone/iPad Trader, Droid Trader, Mobile Trader, MT5 | ||
 Your capital is at risk
Founded: 2006 Your capital is at risk
Founded: 2006 |
|
CySEC, DFSA, FCA, FSB, SIA | MetaTrader4, MetaTrader5, cTrader, FxPro Edge (Beta) | ||
|
|
|
CySEC, FSC, FSCA, MISA | MT4, MT5, OctaTrader | ||
Risk Statement: Trading financial products carries a high risk to your capital, especially trading leverage products such as CFDs. They may not be suitable for everyone. Please make sure that you fully understand the risks. You should consider whether you can afford to take the risk of losing your money.