- Weak German GDP numbers show the country has entered a recession.
- Investors are flocking to the security of the US dollar.
- The US debt-ceiling debate will continue to be the main short-term price driver, but is it the end of the EURUSD bull run?
The prospects for EURUSD continue to be guided by the US debt-ceiling debate, but while the influence of that is hard to discern and relies on soundbites from the Capitol, a good old-fashioned economic data point has caught analysts by surprise. Thursday’s report of German GDP for Q1 2023 showed the Eurozone’s most important economy stumbled into a technical recession over the winter period.
Eurozone Fundamental Outlook
Two successive quarters of negative economic growth are considered enough to determine that an economy has entered a recession. On Thursday, Q1 growth in Germany was reported to be -0.30% and follows -0.50% growth in Q4 of 2022. The surprise element comes from authorities having previously suggested growth would be flat, 0.00%, which would have avoided the ‘R’ tag being applied.
The conflict between Russia and Ukraine continues to dominate the Eurozone outlook. Sanctions against Russia have impacted German manufacturers as well as Russian consumers. It has also driven up fuel prices, which partly explains German consumer spending falling by 1.2% in Q1 as household budgets are squeezed.
There’s plenty of room for the US dollar to weaken as the debt-ceiling deadline of 1st June approaches, but for now, the greenback is proving attractive to those looking for security the euro can’t offer. That has brought EURUSD to key technical price points, which look set to play a role in determining short-term price moves.
Key Technical Indicators for EURUSD
The EURUSD rally, which occurred between 15th March and 26th April, resulted in a 5.51% increase in the euro’s value. The subsequent price slide from the highs of 1.10956 was associated with periods where the decline stalled at key Fibonacci retracement support levels. At each of the 23.6%, 38.2%, and 50% levels, the price of EURUSD consolidated for at least two days.
EURUSD – Daily Price Chart 2022 – 2023 – Fib Retracement
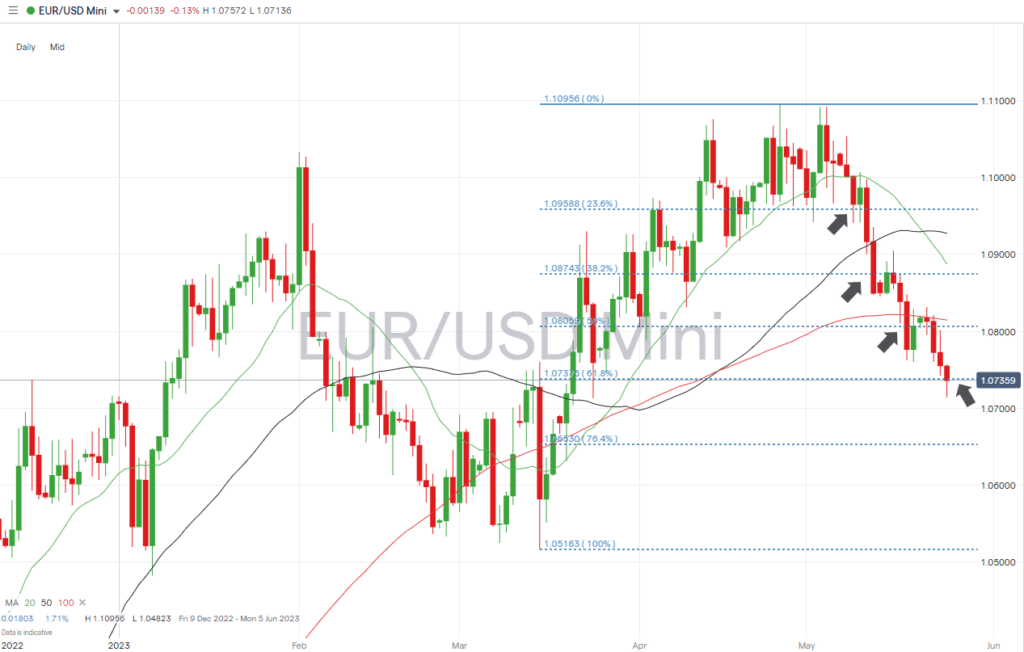
Source: IG
With price now at 1.10736, the 61.8% Fib retracement at 1.07375 comes into play. At the same time, support is expected from the 20 SMA on the Monthly Price Chart, currently at 1.07323. Both of those longer-term metrics could act as a trigger for buyers to step in. Even if the view is that any price increase might be short-lived, it could present a scalping opportunity.
EURUSD – Monthly Price Chart 2022 – 2023 – 20 SMA
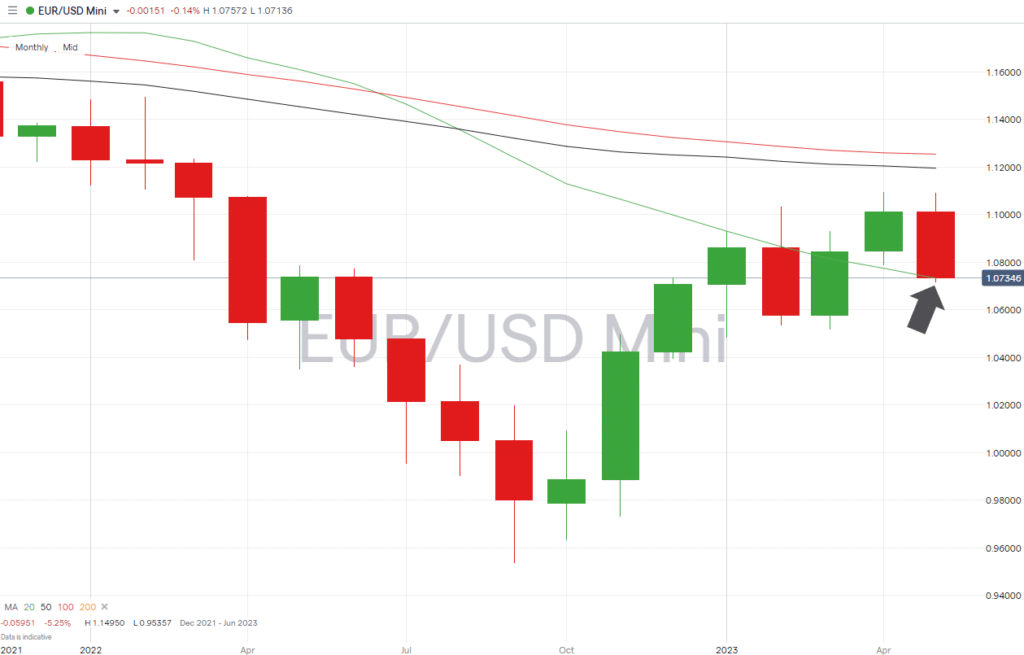
Source: IG
People also Read:
- Is Now the Time to Buy into the Debt-Ceiling Bounce?
- How Much Higher Can Sterling Go?
- The Best and Worst Performing Currency Pairs in April 2023
If you have been the victim of a scam, suspect fraudulent behaviour, or want to know more about this topic, please contact us at [email protected]
 Your capital is at risk
  Your capital is at risk