
A barnstorming shift into risk last week saw traders across a range of asset groups post positive returns. Sterling and crude posted negative price returns that could be explained away as price consolidation after months of upward movement.
| Instrument | 5th April | 12th April | Hourly | Daily | % Change | |||
| GBP/USD | 1.3830 | 1.3701 | Sell | Strong Sell | -0.93% | |||
| EUR/USD | 1.1748 | 1.1887 | Strong Sell | Neutral | 1.18% | |||
| FTSE 100 | 6,781 | 6,897 | Buy | Strong Buy | 1.71% | |||
| S&P 500 | 4,033 | 4,117 | Strong Buy | Strong Buy | 2.08% | |||
| Gold | 1,727 | 1,740 | Neutral | Neutral | 0.75% | |||
| Silver | 2,474 | 2,514 | Neutral | Neutral | 1.62% | |||
| Crude Oil WTI | 60.56 | 59.11 | Strong Sell | Strong Sell | -2.39% | |||
| Bitcoin | 57,182 | 60,313 | Buy | Buy | 5.48% | |||
Source: Forex Traders Technical Analysis
GBPUSD – Key indicator: Price is currently printing around the 100 Daily SMA. An intersection of the 100 SMA by the 20 SMA looks on the cards for the tail-end of this week. Watch currently declining trading volumes suggesting buyers are consolidating rather than capitulating.
GBPUSD – Daily Price Chart – SMA patterns
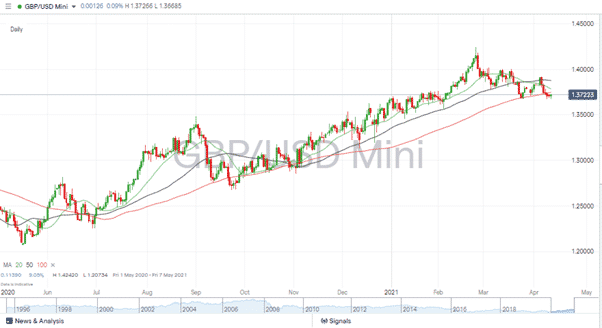
Source: IG
GBPUSD – Daily Price Chart – Watch Volume
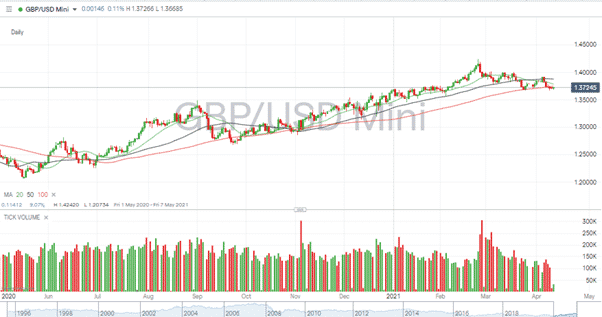
Source: IG
US Equity Indices
With the S&P 500 posting a +2% weekly gain, it might, at first sight, appear churlish to urge caution. Those already in long positions will be looking to make further gains as the global geopolitical climate still seems benign. It could, though, be too late to join the party with the risk of a short-term pullback.
Nasdaq 100 – Key Indicator: Resistance at 13850.
Nasdaq 100 – Meeting Resistance
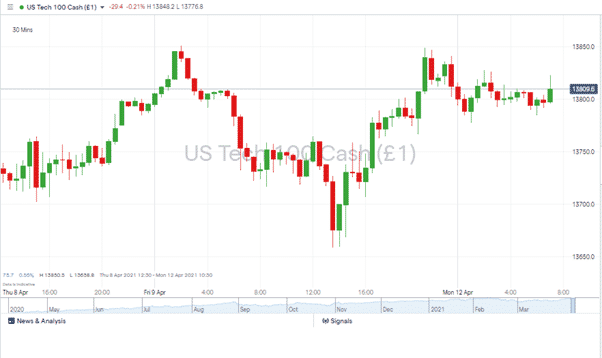
Source: IG
Gold and Silver
Both the precious metals benefited from the general market uplift. While the equity markets might be due a cooling off period, fans of the metals will be familiar with the way prices in the two can build momentum that continues for days or weeks.
Silver – Daily price chart
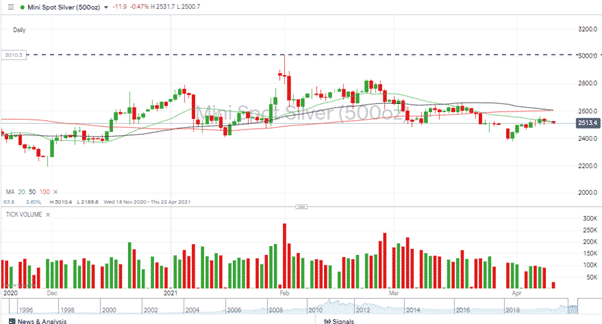
Source: IG
Silver – Key indicators: Trading volumes have tailed off, making a break of the daily 20 SMA more of a challenge. If price does break that resistance, even in light trading, then there is almost a dollar’s worth of headroom before the next two big averages, and ‘big number’ resistance come in to play near the $26 mark.
Bitcoin
Talking of ‘big number’ resistance brings Bitcoin into the spotlight. The crypto has demonstrated relative maturity since its surge from below $20 to above $50. That could reflect increased interest from institutions and corporations, which supports the case for Bitcoin becoming more widely accepted.
Bitcoin – Daily price chart – Key support levels
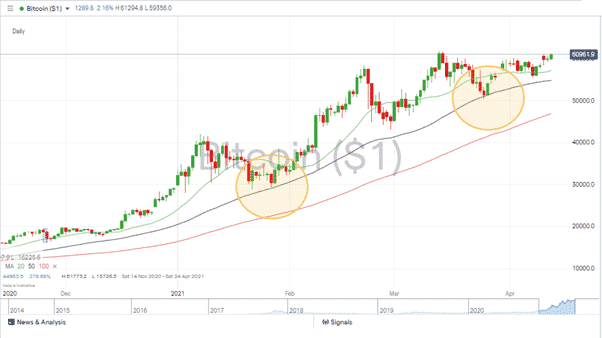
Source: IG
Bitcoin – Key indicators: The all-time high of $61,773, posted on the 13th of March, is the headline resistance level to monitor. A break of that level can be expected to generate another round of mainstream media reporting on the market and draw in more new entrants.
The Daily 50 SMA has provided support in January and March and looks like the vital safety net for those looking to go long. Currently trading at $54,784, it’s relatively close to the current price.
If you want to know more about this topic, please contact us at [email protected]
 Your capital is at risk
  Your capital is at risk